
Tracking the sky from your own backyard is one of the oldest, simplest ways to engage with science. When you learn how to keep a daily weather observation log at home, you turn five minutes a day into a record of your local microclimate that grows more valuable every year. You do not need expensive gear or a meteorology degree to start.
Our team has watched hobbyists go from a single notebook and a phone to full backyard weather stations contributing real data to national programs. The path is the same whether you are eight or eighty: pick a time, record what you see, repeat. This guide walks you through every step so your log is accurate, consistent, and genuinely useful.
Table of Contents
What Is a Daily Weather Observation Log and Why Keep One?
A daily weather observation log is simply a running record of atmospheric conditions taken at the same location each day. You note temperature, precipitation, cloud cover, wind, and anything else worth remembering. The “log” can be a paper notebook, a spreadsheet, or a dedicated app.
People keep these logs for dozens of reasons. Gardeners want frost dates and rainfall totals so they know when to plant and water. Homeschool families use weather tracking as a hands-on science lesson. Photographers and hikers care about sky conditions for planning outings. Serious hobbyists feed their data into citizen science networks that help the National Weather Service verify storm reports.
The real magic shows up after a few months. You start noticing that your yard runs three degrees cooler than the official airport reading, or that thunderstorms almost always roll in from the southwest. That kind of local insight is something no app can give you.
What You Need to Get Started With a Home Weather Log?
Here is the good news: you can begin today with items you already own. Every hobbyist in the r/weather community started somewhere simple, and most recommend beginning bare-bones before buying anything.
Essential Supplies for Day One
Grab a notebook (any kind works, but a bound journal with dated pages feels more permanent) and a pen. Add a phone or computer for checking the current temperature from a nearby station if you do not have a thermometer yet. That is enough to make your first entry.
You will also want a consistent spot outdoors where you check conditions, ideally one that is shaded and away from pavement. A north-facing wall is a classic choice because it avoids direct sun heating. Decide on this location before your first observation so your readings stay comparable over time.
Optional Starter Equipment
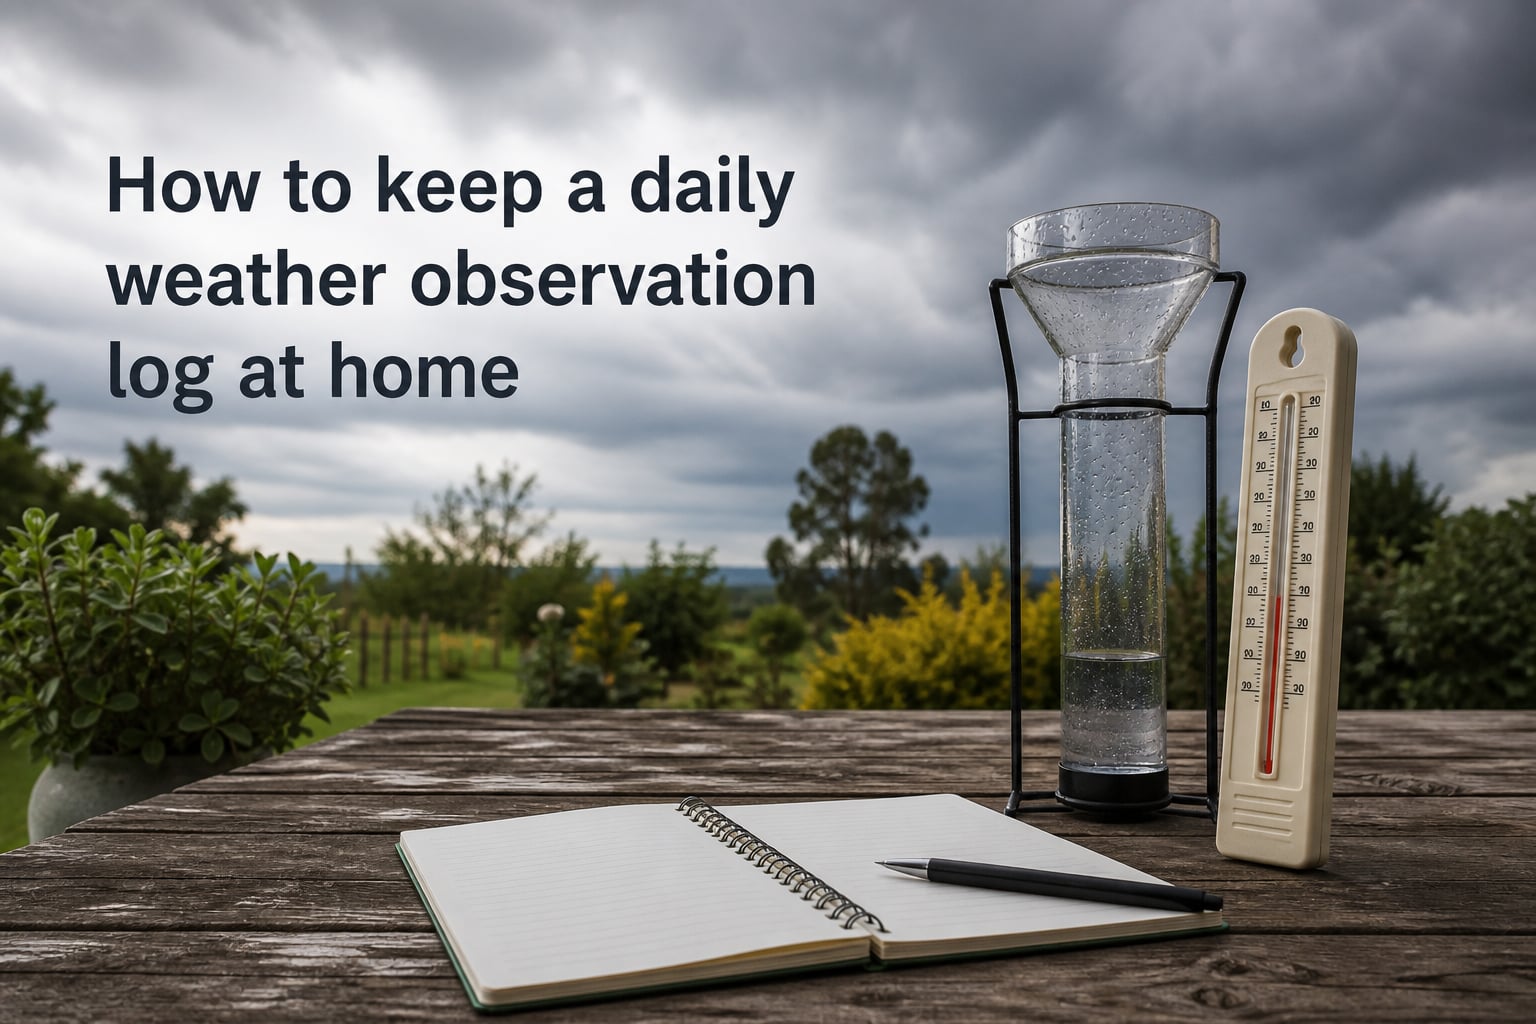
Once you are hooked, a few affordable tools make your log more accurate. A basic max/min thermometer (often under $20) tracks the high and low since your last reading. A simple cylindrical rain gauge lets you measure precipitation to the nearest hundredth of an inch, which is the standard unit used by professional observers.
You can build your own rain gauge from a straight-sided jar and a ruler if you want to start at zero cost. The reading will not be precise to the hundredth, but it teaches the principle and gets you in the habit of checking daily. Our team has seen hobbyists run DIY gauges alongside commercial ones with surprisingly close results.
How to Choose What to Record in Your Weather Log?
Choosing what to write down is the most common question on weather forums, and the answer depends on your goals. A basic log covers five core parameters. A more detailed log adds humidity, barometric pressure, and qualitative notes about the day.
Core Parameters for Every Day
At minimum, record the date, time of observation, current temperature, sky condition (clear, partly cloudy, overcast), and any precipitation since your last reading. These five items take under a minute to capture and form the backbone of any weather journal.
Wind is worth adding early because it changes the feel of a day dramatically. A simple estimate works fine: calm, light breeze, breezy, windy, or strong wind. You can refine this with a handheld anemometer later. Many observers also jot a one-line note about visibility, such as “hazy” or “crystal clear,” since it hints at humidity and air quality.
The Four Main Types of Weather Observations
Meteorologists generally categorize observations into four types, and understanding them helps you structure your log intelligently. Surface observations measure conditions at ground level, which is what most home observers track. Upper-air observations use balloons or satellites to sample the atmosphere above, which is beyond home scope but useful context.
The third type is radar and satellite observation, where remote sensing paints a picture of precipitation and cloud cover over a region. The fourth is automated observations from official stations that report continuously. Your backyard log fills in the on-the-ground detail between these systems, which is exactly why citizen science programs value it.
Step-by-Step: How to Set Up Your Weather Observation Log
Setting up your log properly from day one saves frustration later. Follow these steps and you will have a system that is easy to maintain for years.
Step 1: Choose your format. Pick a paper notebook, a printable weather log sheet, or a spreadsheet (Google Sheets and Excel both work well). Free printable templates exist online, or you can draw columns by hand on lined paper.
Step 2: Decide your columns. A solid starter layout includes Date, Time, Temperature, Sky Condition, Precipitation, Wind, and Notes. Add columns for humidity, barometric pressure, or max/min temperature as your equipment and interest grow.
Step 3: Pick your observation time. Most observers choose either early morning (around 7 a.m.) or evening. Morning readings capture overnight lows and any overnight precipitation, which lines up with how the NWS reports daily totals.
Step 4: Set up your observation spot. Place any thermometers in shade, away from brick, concrete, or air conditioner exhausts. Mount a rain gauge in an open area, away from trees and rooflines that could block or redirect rainfall.
Step 5: Make your first entry. Do not wait for a “perfect” day. Record whatever is happening right now, even if it is boring and clear. The point is to start the habit.
Step 6: Add a weekly review. Every Sunday, glance back at the week and circle anything notable. This builds pattern recognition and keeps you motivated when individual days feel routine.
Best Time of Day and How Often to Take Observations
Consistency matters more than perfection. The single most important rule of weather logging is to observe at roughly the same time every day. Pick a time you can actually stick with, even on weekends and busy mornings, and protect it like any other daily ritual.
Once-daily observation is plenty for a home log. Official cooperative observers for the NWS take a single reading every 24 hours, typically near sunrise or at a set local time. If something interesting happens between readings, you can always add a note without disrupting your standard entry.
Try to keep your observation within a 30-minute window of your chosen time. If you normally log at 7 a.m. but sleep in until 9 on a Saturday, your temperature reading will look warmer than usual. Note the time change in your log so future-you understands the discrepancy rather than assuming the day was genuinely warmer.
Measuring Temperature, Precipitation, Wind, and Cloud Cover Accurately
Accurate measurements come down to placement and technique. A great thermometer in full sun is worse than a cheap one in proper shade. Here is how to handle each parameter correctly.
For temperature, mount your thermometer four to six feet above ground level in a shaded, ventilated spot. A north-facing wall under an eave works well. Avoid enclosed porches that trap heat. If you use a max/min thermometer, reset it after each reading so it captures the next 24-hour cycle.
For precipitation, place your rain gauge in an open area at least as far from obstacles as those obstacles are tall. Read the gauge at eye level on a flat surface, then empty it. For snow, measure depth in several flat, open spots and average them. CoCoRaHS recommends measuring snowfall on a white board placed at ground level, cleared after each reading.
For wind, face into the breeze and note direction using landmarks (toward the oak tree means north, for example). A handheld anemometer gives you speed in miles per hour, but the Beaufort scale (calm through hurricane) works well for visual estimates. Cloud cover is best estimated by looking straight up and noting how much blue sky you can see: clear (no clouds), few (one-eighth to one-quarter), scattered (one-quarter to one-half), broken (one-half to seven-eighths), or overcast (full cover).
Paper Notebook vs Digital Spreadsheet: How to Organize Your Weather Log
The paper-versus-digital debate is alive and well in every weather forum, and the honest answer is that both work. The best choice is whichever one you will actually use consistently.
Paper notebooks are cheap, never crash, and feel satisfying. They also let you sketch clouds, tape in photos, and jot observations in the moment without unlocking a device. The downside is that searching across years of data means flipping pages, and a spilled coffee can erase a decade of records.
Spreadsheets win on analysis. With columns set up once, you can sort by month, chart temperature trends, and calculate yearly rainfall totals in seconds. Google Sheets is free and backs up automatically. Many hobbyists use both: a paper notebook for the daily ritual and a weekly transfer into a spreadsheet for safekeeping and pattern-spotting. This hybrid approach is what our team recommends to anyone serious about long-term tracking.
Apps like Weather Underground and dedicated weather journal apps offer a third option. They handle data storage and often feed into citizen science networks automatically. The trade-off is less control over your format and dependence on the app staying online.
Upgrading Your Home Weather Station Over Time
One of the most reassuring things about this hobby is that there is a clear upgrade path. You do not buy everything at once. Instead, you add tools as your curiosity grows and your budget allows.
The typical progression looks like this: notebook and phone, then a max/min thermometer and rain gauge, then a hygrometer for humidity and a barometer for pressure. After a year or two of solid manual observation, many hobbyists invest in an electronic backyard weather station that logs temperature, humidity, pressure, wind speed, wind direction, and rainfall automatically.
When you upgrade, mount electronic sensors following the manufacturer guidelines but apply the same placement principles: shade for thermometers, open sky for rain gauges, unobstructed exposure for wind sensors. Keep your manual observations going for a few weeks alongside any new electronic sensor so you can compare readings and catch calibration issues.
Joining Citizen Science Programs (CoCoRaHS and More)
This is where a personal hobby becomes part of something bigger. Citizen science programs take your daily observations and fold them into datasets that researchers and forecasters actually use.
CoCoRaHS, the Community Collaborative Rain, Hail and Snow Network, is the most popular entry point for home observers in the United States. You get a standardized rain gauge, take a single morning reading, and report it through their website or app. Your data appears on maps that the NWS consults during flood events and drought assessments.
The NWS Cooperative Observer Program is the longest-running citizen weather network in the country, with records dating back to the 1890s. It requires more commitment but provides official equipment and training. Beyond these, weather apps like Weather Underground let you share data from an electronic station with a global community. Even if you never join a formal program, your local log has value for you, your family, and your neighborhood.
Common Mistakes to Avoid in Your Daily Weather Observations
Most errors in home weather logs come from a handful of avoidable habits. Knowing them up front keeps your data trustworthy.
Placing thermometers in direct sun is the number one mistake. A thermometer reading 110 degrees Fahrenheit on a 75-degree day is not measuring the air; it is measuring sunlight absorbed by its housing. Always shade your sensors.
Reading the rain gauge at an angle instead of eye level adds error to every precipitation total. Set the gauge on a table or hold it at eye height, then read the bottom of the meniscus (the curved surface of the water).
Inconsistent timing creates false trends. If you log at 6 a.m. on weekdays and 10 a.m. on weekends, your temperature column will look like a sawtooth pattern that has nothing to do with actual weather. Pick one time and hold to it.
Skip days happen to everyone, and that is fine. The mistake is leaving a blank without context. Write “no reading” or “away” so you know later that the gap is intentional, not a lost page. Never estimate a reading retroactively and pass it off as measured.
Visualizing Your Data and Spotting Local Patterns
Data sitting in a notebook is useful, but data plotted on a chart becomes insight. This is the step most home observers skip, and it is also the most rewarding.
If you use a spreadsheet, chart your daily high and low temperatures as a line graph over the year. The curve will reveal your local growing season, first and last frost dates, and the swing between summer peaks and winter troughs. Add a second chart for monthly rainfall totals to spot wet and dry stretches that explain why your garden thrived one year and struggled the next.
For paper loggers, a simple monthly summary at the bottom of each page works wonders. Jot the warmest day, coldest day, total rainfall, and number of clear versus cloudy days. After a year, compare December to December. After five years, you will have a portrait of your local climate that no weather app can match because no app measures your specific yard.
Look for patterns like the timing of your first thunderstorm each spring, the prevailing wind direction before rain, or how quickly temperatures drop after sunset on clear nights versus cloudy ones. These observations connect your daily ritual to the larger story of your local weather and, over the years, your changing climate.
Frequently Asked Questions
How to keep a weather journal?
Pick a notebook or spreadsheet, choose one observation time each day, and record date, temperature, sky condition, precipitation, wind, and a short note. Take readings at the same time daily and review your entries weekly to spot patterns.
Where do weather observers make their observations?
Home observers take readings in a fixed outdoor spot, ideally a shaded, north-facing location away from pavement and heat sources. Official observers use similar shaded, ventilated sites, and CoCoRaHS volunteers place rain gauges in open areas clear of trees and buildings.
How to make a daily weather chart?
Create columns for Date, Time, Temperature, Sky Condition, Precipitation, Wind, and Notes on paper or in a spreadsheet. Fill in one row per day at your chosen observation time, then chart the temperature and rainfall columns weekly or monthly to visualize trends.
What are the four types of weather observations?
The four main types are surface observations taken at ground level, upper-air observations sampled by balloons and satellites, radar and satellite observations using remote sensing, and automated observations from official stations that report continuously. Home observers focus on surface observations.
What equipment do I need to start a weather observation log at home?
You need only a notebook, a pen, and a consistent outdoor observation spot to begin. Optional starter tools include a max/min thermometer and a simple cylindrical rain gauge, both affordable and widely available.
How often should I record weather observations?
Record once per day at roughly the same time, ideally within a 30-minute window. Once-daily readings match the standard used by National Weather Service cooperative observers and are enough to build a meaningful long-term record.
Conclusion
Learning how to keep a daily weather observation log at home is less about equipment and more about consistency. A notebook, a fixed observation time, and five minutes a day are all you need to build a record that grows more interesting with every passing season. Start simple, upgrade when curiosity pushes you, and consider sharing your data with a citizen science program once you trust your routine. The sky is waiting, and your first entry is just a glance out the window away.