
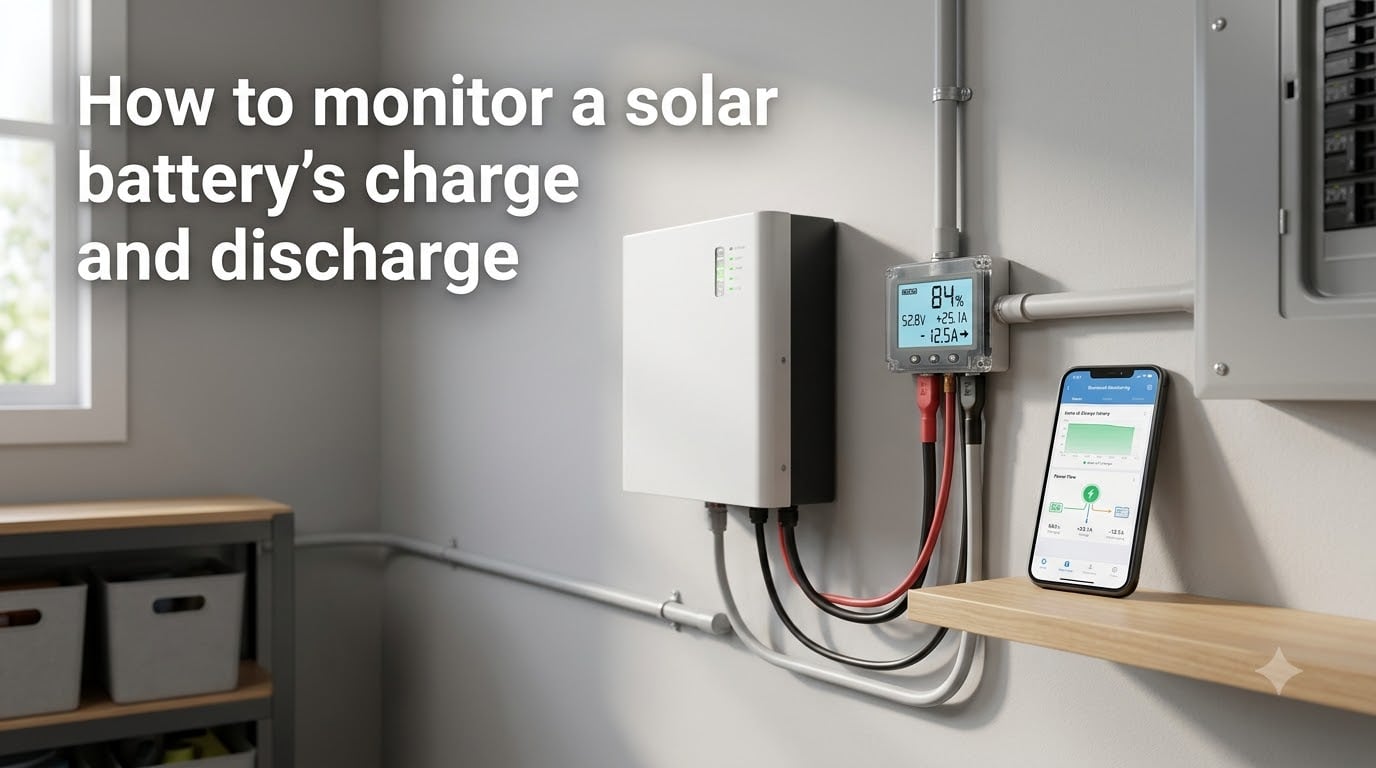
When I installed my first solar battery five years ago, I thought the inverter’s blinking light was enough. After watching two batteries fail prematurely, I learned that monitoring your solar battery’s charge and discharge isn’t optional — it’s the single biggest factor in lifespan. This guide covers every method I’ve used, from a $15 multimeter to Bluetooth smart shunts, so you can pick what fits your system and budget.
Whether you run an off-grid cabin, a grid-tied home with backup, or a small RV setup, you’ll find practical steps here. I draw on community wisdom from r/SolarDIY and diysolarforum threads, plus hands-on testing across lithium and lead-acid banks.
Table of Contents
What Is Solar Battery Monitoring and Why It Matters?
Solar battery monitoring is the practice of tracking how much energy flows into and out of your battery, along with the conditions that affect those flows. At its core, it answers four questions: how full is the battery, how fast is it filling or draining, how hot is it running, and how healthy is it over time.
Ignoring those answers costs you money. A battery that regularly hits 100% depth of discharge can lose 50% of its cycle life within a year. Overcharging a lithium bank above its absorption voltage can trigger permanent capacity loss. Freezing a lead-acid battery while discharged cracks the plates. I’ve seen all three happen to neighbors who skipped monitoring.
Good monitoring pays back in three ways. First, it catches small problems before they become dead batteries. Second, it lets you maximize usable capacity without crossing safety limits. Third, it gives you hard data on whether your system is actually saving money or just feeling like it is.
Key Metrics to Track: SOC, Voltage, Current, and Temperature
Every monitoring method, from a $15 multimeter to a $300 smart shunt, reports on the same underlying metrics. Once you understand these four numbers, you can interpret any display you’d rather use.
State of Charge (SOC)
State of charge is the percentage of usable energy left in your battery. A reading of 100% means full; 20% means you’re getting close to the cutoff. SOC is the number most people actually want, but it’s also the one most often displayed inaccurately, especially by voltage-only monitors on lithium batteries.
Voltage
Voltage is the raw electrical pressure in the battery. For a 12V lead-acid battery, 12.6V is full and 11.8V is empty. For a 12V lithium (LiFePO4) battery, the usable range sits between 14.4V (full) and about 12.0V (empty), with a near-flat curve in between. Voltage alone is unreliable for SOC when current is flowing, which is why experienced users pair it with a shunt.
Current (Amps) and Power (Watts)
Current tells you how fast energy is moving. Charge current shows how hard your panels are pushing; discharge current shows how much your loads are pulling. Multiply volts by amps to get watts, which is what your inverter’s display usually shows.
Temperature
Temperature affects both capacity and safety. Lithium batteries charge poorly below 32°F (0°C) and can be damaged. Lead-acid batteries lose capacity in cold and degrade faster in heat above 77°F (25°C). A sensor in the BMS or a clip-on thermistor gives you this data.
Depth of Discharge (DOD) and Cycles
Depth of discharge is the inverse of SOC. If you regularly discharge to 20% SOC, that’s an 80% DOD. Most lithium batteries are rated for 4,000-6,000 cycles at 80% DOD, but only 1,000-2,000 at 100% DOD. Tracking DOD over time tells you how much life you’ve used.
Monitoring Methods: Multimeter, BMS, Charge Controller, and Apps
There are four common ways to monitor solar battery charge and discharge. Each has tradeoffs in cost, accuracy, and convenience, and most serious systems combine two or more.
Multimeter (Manual, Low Cost)
A digital multimeter measures voltage directly and current with a clamp accessory. It costs $15-40 and gives instant readings with no setup. The downside: you only get a snapshot, not a log, and you have to do the math for SOC yourself.
Battery Management System (BMS, Built-in)
Every modern lithium battery has a BMS that monitors cell voltage, temperature, and current at the cell level. It protects against overcharge, over-discharge, and short circuits. Some BMS units expose data via Bluetooth or RS485, while others just silently shut things down when limits are hit.
Charge Controller (PWM or MPPT)
Your charge controller sees the full charge cycle and usually displays voltage, charge current, and battery SOC. PWM controllers often show only a rough percentage based on voltage, which is the source of many forum complaints about “stuck at 50%.” MPPT controllers with proper SOC algorithms are more accurate but still imperfect without a shunt.
Smart Shunt and Monitoring App
A smart shunt like the Victron SmartShunt, Renogy Battery Monitor, or AiLi is the gold standard for accurate monitoring. It sits in the negative battery cable, measures every amp in and out, and uses a coulomb-counting algorithm to track SOC precisely. Pair it with the manufacturer’s app for Bluetooth data, or wire it to an inverter for full system integration.
Inverter Display
Most grid-tied inverters (SolarEdge, Enphase, Fronius, Tesla) include a built-in monitor that pulls data from the battery’s BMS or a shunt. These are convenient and usually have a web portal, but accuracy depends on the data source. Tesla Powerwall, for example, is very accurate; older string inverters reporting SOC from voltage alone are less reliable.
How to Use a Multimeter to Test Battery State of Charge
The cheapest way to monitor a solar battery is with a multimeter. It takes 60 seconds and gives you a usable voltage reading. Follow these steps for a 12V lead-acid battery; for lithium, consult the manufacturer’s voltage chart.
Disconnect all chargers and loads, then wait at least 30 minutes for the surface charge to dissipate. A reading taken during charging is misleading.
Set your multimeter to DC volts on the 20V range.
Touch the red probe to the positive (red) terminal and the black probe to the negative (black) terminal.
Read the voltage. For a 12V lead-acid battery: 12.6V is 100%, 12.4V is 75%, 12.2V is 50%, 12.0V is 25%, and below 11.8V is empty.
For lithium (LiFePO4), 13.4V is full, 13.0V is roughly 80%, and 12.5V is roughly 30%. Voltage drops off sharply below 12.0V.
For more accuracy, repeat the test under a known load. A 10-amp load for 5 minutes simulates real use and gives you a better idea of true SOC. Just don’t run a deeply discharged battery below its rated cutoff, or you’ll permanently damage it.
DIY vs Commercial Battery Monitoring Solutions
If the built-in options don’t satisfy you, you’ve got two paths: build your own with an Arduino or Raspberry Pi, or buy a commercial smart shunt. Here’s how they compare.
DIY Monitoring with Arduino or Raspberry Pi
A DIY setup uses a current sensor (INA219 or Hall-effect), a voltage divider, and a temperature sensor wired to a microcontroller. Total cost runs $30-80. The advantage is full customization — you can log to a CSV file, build a dashboard, or send alerts. The downside is you need to code it, wire it carefully, and calibrate it. I’ve built two of these for off-grid projects, and the calibration step trips up most beginners.
Commercial Smart Shunts
Commercial units cost $80-300 and come pre-calibrated. The Victron SmartShunt pairs with the VictronConnect app and integrates with their inverter-chargers. Renogy and AiLi offer similar Bluetooth monitors. These are accurate to within 1-2% on a well-charged bank. They also store historical data so you can see trends over weeks.
Which Should You Choose?
Pick DIY if you’re comfortable with electronics and want full control. Pick a commercial shunt if you want to install it once and forget about it. For most homeowners, a $150 smart shunt is the sweet spot of accuracy and convenience. For off-grid cabins where reliability matters more than data, combine a smart shunt with a Victron inverter for a fully integrated system.
Troubleshooting Inconsistent or Unreliable Readings
Forum threads are full of users asking why their battery monitor shows 50% when the battery is clearly fuller. Here are the most common causes and fixes, drawn from real cases on r/SolarDIY and diysolarforum.
Voltage-Only Monitors on Lithium Batteries
Lithium batteries hold a nearly flat voltage curve across most of their SOC, then drop sharply at the end. A voltage-based monitor can show 50% when the battery is actually at 70%. The fix is to use a shunt-based monitor that counts amp hours in and out, not just voltage.
Uncalibrated Shunt
A new shunt needs to be calibrated to your battery’s rated capacity. If you tell it you have a 200Ah battery when you actually have 100Ah, the SOC will be wrong. Also, after switching battery types (e.g., from lead-acid to lithium), the shunt needs a full charge-discharge cycle to relearn.
Bluetooth Lag and App Refresh Delays
Apps can take 1-5 minutes to refresh. The inverter display is usually faster. If your app disagrees with the inverter, trust the inverter for real-time decisions and the app for historical trends.
Loose Connections or Corroded Terminals
A dirty terminal can cause a 0.5V voltage drop between the battery and the monitor. That alone will throw SOC readings off by 20-30%. Clean your terminals with a wire brush and tighten all connections. I check mine every six months.
PWM Controller Showing Wrong State of Charge
Basic PWM controllers estimate SOC from voltage and assume a flooded lead-acid profile. They are wildly inaccurate for lithium and gel batteries. If accuracy matters, bypass the controller’s SOC display and use a dedicated shunt instead.
Best Practices for Long-Term Battery Health
Monitoring is most useful when paired with habits that protect the battery. These are the practices I follow on my own system and recommend to anyone who asks.
Avoid Extreme Depth of Discharge
Keep DOD under 80% for lithium and under 50% for lead-acid if you want maximum cycle life. Set your inverter’s cutoff to 20% SOC for lithium and 50% for lead-acid. Yes, this gives you less usable capacity, but the trade-off is years of extra life.
Manage Temperature
Keep batteries in a temperature-controlled space when possible. Cold kills lithium charging; heat kills every battery type. If your battery is outdoors, insulate the enclosure but vent it. A $20 temperature sensor connected to your monitor will alert you to problems.
Run a Full Equalization Charge Periodically
For flooded lead-acid batteries, an equalization charge every 30-60 days balances the cells. For lithium, this is not needed and can be harmful. Check your battery type before pressing that button.
Log Data and Review Trends
A single reading is a snapshot. A graph is a story. Most smart shunts and inverter apps let you export daily or weekly logs. Review them monthly to spot slow decline. If your usable capacity drops 10% over a year, it might be time to plan a replacement.
Watch for Warning Signs
Sudden SOC drops, abnormal temperature spikes, capacity falling faster than the calendar date suggests, or the BMS triggering shutdowns — these are all signals to dig deeper. Catching a failing cell early can save the rest of the bank.
Frequently Asked Questions
How do I check the health of my solar battery?
Check voltage with a multimeter after a 30-minute rest, then compare to the manufacturer’s SOC chart. For accuracy, use a shunt-based monitor that counts amp hours in and out. Track capacity over time — if usable amp hours drop 10% or more per year, the battery is degrading.
How do I monitor my solar panel output?
Most inverters and charge controllers display panel output in real time on a built-in screen or web portal. Bluetooth apps from SolarEdge, Enphase, and Victron show wattage, daily energy, and lifetime production. For DIY systems, an inline wattmeter between panels and the charge controller gives the same data at a lower cost.
What is the discharge rate of a solar battery?
Discharge rate is measured in amps or as a C-rate. A 100Ah battery discharged at 1C delivers 100 amps; at 0.2C it delivers 20 amps. Most solar batteries are rated for 0.2C to 1C continuous. Higher rates produce more heat and reduce usable capacity.
Why does my solar battery discharge?
Solar batteries discharge whenever the loads draw more power than the panels supply. At night, all loads pull from the battery. During the day, cloudy weather or heavy appliance use can also tip the balance into discharge. Some self-discharge happens naturally even with no load — typically 1-3% per month for lithium and 4-15% for lead-acid.
Final Thoughts on Monitoring Solar Battery Performance
Monitoring your solar battery’s charge and discharge isn’t complicated once you know the four key metrics: SOC, voltage, current, and temperature. A $15 multimeter gets you started, but most users upgrading to a smart shunt end up wishing they had done it sooner. Pick the method that matches your battery type and budget, pair it with good charging habits, and your battery will give you years of reliable service.
If you’re setting up a new system, start with a shunt-based monitor from day one. If you’re troubleshooting an existing one, work through the common issues — calibration, connection corrosion, voltage-only errors — before replacing hardware. The data is already there; you just need to read it correctly.