
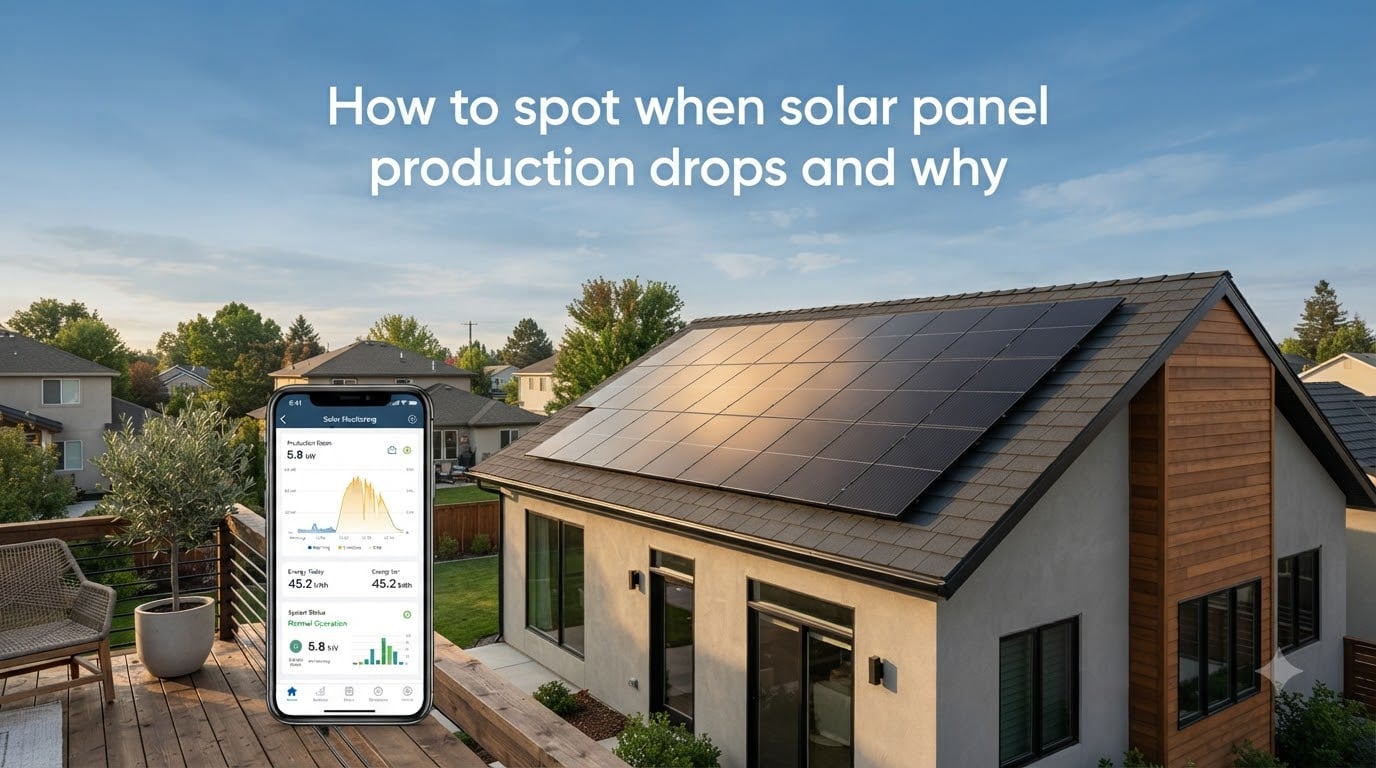
Last summer, my neighbor called me in a panic. His electric bill had jumped by $80 even though nothing had changed about his routine. Same AC schedule, same pool pump, same work-from-home setup. We walked over to his inverter, opened his monitoring app, and compared his July production to July of the previous year. His system was producing 22% less energy, and he had no idea why.
That situation plays out thousands of times a year across the country. A homeowner notices a higher bill, a smaller credit on their utility statement, or a graph in their app that suddenly heads downward. The instinct is to assume the worst, and most people have no idea where to start looking.
If you want to know how to spot when solar panel production drops and why it happens, you are in the right place. I have spent the last several months helping friends, family, and forum readers diagnose drops like this, and most of the time the cause is something you can identify yourself with a little guidance.
This guide walks you through the signs of a real production drop, the nine most common causes I see in the field, and a step-by-step process for figuring out which one applies to your system. By the end, you will know exactly what to check before you spend money on a service call, and you will have a clear plan for keeping your system producing at its best for the next 25 years.
I have also included a comparison table, an FAQ section that answers the questions Google shows most often for this topic, and a dedicated section on orphaned systems, which is a growing problem that most guides barely mention.
Table of Contents
How to Spot When Solar Panel Production Drops and Why?
A solar panel production drop happens when your system generates noticeably less electricity than expected for the conditions. Drops fall into three categories. Normal drops follow seasonal sunlight patterns and predictable annual degradation of about 0.5% per year. Abnormal drops come from equipment faults, new shading, or soiling that you can fix. Severe drops signal component failures that need professional attention before they damage other parts of your system.
The reason this matters is simple. Most solar systems pay for themselves over 20 to 25 years, and that math depends on steady production. A drop you ignore today becomes lost savings for the next two decades. Catching it early often means a $200 cleaning instead of a $4,000 inverter replacement, and that is not an exaggeration.
The good news is that most drops are diagnosed without ever climbing on a roof. Your inverter, your monitoring app, and a basic visual inspection from the ground will reveal the cause in about 80% of cases. The remaining 20% require a professional, but you will know which category you are in before you make the call.
5 Signs Your Solar Panels Are Underperforming Right Now
You do not need to be an electrician to spot trouble. Here are the five signals I check first whenever someone tells me their system “feels off.” Each one is something a regular homeowner can verify in minutes without special tools.
1. Your electric bill is climbing without a lifestyle change. Compare your kilowatt-hour usage month over month. If you are using the same amount of power but your solar credits have shrunk, the system is producing less. Look at the “net” or “credits applied” line on your utility statement, not just the total.
2. Your monitoring app shows a steady downward trend. Open your inverter or panel-level monitoring app. Look at the last 30 days versus the same window last year. A consistent 10% or greater drop is worth investigating. Single-day dips are usually weather, but a multi-week trend is a real signal.
3. You can see physical changes on the panels. Walk outside and look up. New tree growth, bird nests, heavy pollen layers, or cracked glass are visible without any special tools. Binoculars help if the array is on a steep roof or a second story.
4. The inverter shows error codes or a red status light. Most inverters flash a specific pattern or display a code when something is wrong. Check your inverter manual for what each code means. Common codes include arc fault, ground fault, and grid voltage errors.
5. Your neighbors with similar systems are producing more. This is not scientific, but it is a useful gut check. If your system is identical to one three doors down and yours is producing 15% less, something is off. Ask them what their monitoring app shows.
Normal vs Abnormal Production Drops: Where Does Yours Fall?
Not every dip in your numbers means something is broken. Solar panels naturally produce less as they age, and the sun’s angle changes throughout the year. Knowing the difference between normal wear and a real problem saves you from chasing ghosts.
The industry standard for normal degradation is about 0.5% per year for the first 25 years, with a slightly steeper drop (called light-induced degradation) in the first 12 months. So a 10-year-old system should produce roughly 95% of what it did on day one. Anything beyond that points to a real issue worth investigating.
Seasonal variation is the other big “normal” factor. A system in a temperate climate might produce 40% less in December than in June simply because the days are shorter and the sun sits lower in the sky. That is expected. Most monitoring platforms show a one-year-ago comparison that makes this much easier to see.
Here is a quick comparison to help you sort it out:
| Drop Type | Typical Range | What It Means |
|---|---|---|
| Annual degradation | 0.5% per year | Normal panel aging |
| Seasonal variation | 20% to 50% | Sun angle and daylight hours |
| Weather impact | 10% to 90% on cloudy days | Cloud cover, rain, or smoke |
| Soiling | 5% to 25% | Dust, pollen, or bird droppings |
| Equipment fault | 10% to 100% | Failed inverter, wiring, or panel |
If your drop falls into one of the top three rows and matches the listed range, you probably have nothing to worry about. If it falls into the bottom two, it is time to dig deeper.
9 Common Causes of Solar Panel Production Drops
These are the nine causes I see over and over, ordered roughly from most common to least common. Your drop is probably one of these. I have included specific numbers and symptoms for each so you can match what you are seeing on your own system.
Cause #1: Soiling (Dirt, Pollen, and Bird Droppings)
A layer of grime blocks sunlight from reaching the solar cells. In dry, dusty regions or near highways, panels can lose 15% to 25% of their output between cleanings. Pollen in spring and bird droppings year-round create localized hot spots that drag down an entire string.
Bird droppings are particularly nasty because they are acidic and can permanently etch the glass if left for months. Soiling tends to affect panels at the bottom of an array more than the top, since dust and water run downward.
Cleaning is straightforward if you can safely reach the panels. Use a soft brush, water, and avoid walking on the glass. If you cannot reach them safely, a window-cleaning service with extension poles works well. Many homeowners report a 10% to 20% jump in production after a thorough cleaning.
Cause #2: New Shading
Trees grow. Neighbors build additions. A new chimney on the house next door can cast a shadow across your array by mid-afternoon. Even partial shading on one cell can reduce output from that entire panel by 77% to 100%, depending on the inverter type.
Walk the property at different times of day during peak sun hours. If you spot new shadows, consider trimming vegetation or consulting your installer about relocating affected panels. In some cases, adding a microinverter to a shaded panel can isolate its output from the rest of the string.
Cause #3: Failed Microinverter or Optimizer
Microinverters and DC optimizers are small electronics attached to each panel that convert or condition the electricity. They typically last 15 to 25 years, but they do fail. When one fails, only that panel stops producing, which is one advantage of panel-level equipment.
Check your monitoring app for panel-level data. Most systems flag underperforming panels automatically and show error codes for the affected unit. A failed microinverter usually shows zero production on a single panel while the rest of the system performs normally.
Cause #4: String Inverter Problems
String inverters handle the entire array through one box. When they malfunction, you can lose output from many panels at once. Capacitor degradation is a known issue in older string inverters, especially after the 8 to 12 year mark.
Watch for error codes on the inverter display, unusual clicking sounds, or a complete loss of production after years of normal operation. These are signs the unit itself needs replacement. A new string inverter typically costs $1,500 to $3,000 installed, which is much less than a full system replacement.
Cause #5: Monitoring Error
Sometimes the production has not actually dropped. Your monitoring app or inverter communication has lost its connection. I have seen homeowners panic over a 50% drop that turned out to be a disconnected Wi-Fi module.
Confirm by checking your inverter display directly. If the inverter is producing but the app shows nothing, the problem is the monitoring system, not the panels. Restarting the inverter, checking the Wi-Fi signal, or resetting the gateway usually fixes it within an hour.
Cause #6: Panel Degradation
All solar panels lose efficiency over time. Beyond the standard 0.5% per year, environmental stress like heat, humidity, and UV exposure can accelerate the decline, especially in hot climates or coastal areas. Panels in Arizona degrade faster than panels in Vermont under identical use.
Compare your output against the original system’s expected production at the same age. Your installer should have provided a degradation curve at the time of installation. If you cannot find it, the manufacturer’s datasheet will give you a benchmark.
Cause #7: Wiring and Connector Issues
MC4 connectors, junction boxes, and rooftop wiring take a beating from weather and thermal cycling. Loose connections create resistance, which wastes energy as heat and reduces output. Rodents sometimes chew through insulation as well.
Visible burn marks, melted connectors, or a burning smell are urgent warning signs. Turn off the system and call a professional immediately if you see any of these. Loose DC connections are one of the leading causes of solar-related fires, and the problem does not get better on its own.
Cause #8: Weather and Environmental Differences
Year-to-year weather is not the same. A wildfire smoke-filled summer, a wetter-than-average spring, or an unusually cool August all change production. Compare like-for-like conditions before assuming a fault. Smoke from wildfires can cut solar output by 20% to 40% even hundreds of miles from the fire.
Many monitoring platforms now show weather-adjusted expected output, which makes these comparisons much easier. If you do not have that feature, sites like PVWatts let you run a free estimate for your location and system size.
Cause #9: Utility Metering or NEM Configuration Changes
This one trips up a lot of homeowners. If your utility changed your net energy metering (NEM) tariff from NEM 2.0 to NEM 3.0 or similar, the value of the electricity you export may have changed, even if your production has not. Your bill can rise while your production stays flat.
Check with your utility about any recent billing or tariff changes. A quick call can save you from a wild goose chase looking for a problem that does not exist. In California, for example, the NEM 3.0 transition cut export rates by about 75%, which made many homeowners think their systems had failed when they had not.
How to Diagnose the Drop: Step-by-Step Self-Check Process
Before you call a professional, run through this five-step diagnostic. Most drops are caught by step one or two. Take notes and screenshots along the way so you have a record to share with a technician if you end up needing one.
Step 1: Check your monitoring app. Open it on your phone and look at the last 30 days. Note the trend, any error codes, and whether individual panels are flagged. Screenshot the data so you can share it with a technician later. Look at both daily totals and peak instantaneous output for clues.
Step 2: Visually inspect the array. From the ground, scan for shading, dirt, damage, and animal activity. Binoculars help if the panels are on a steep roof. Look for dropped branches, new nests, and any obvious staining or discoloration on the glass.
Step 3: Compare to expected output. Look up your system’s expected output for the current weather and season. PVWatts from the National Renewable Energy Laboratory is a free tool that gives reasonable estimates. Plug in your array size, tilt, and azimuth for a baseline number.
Step 4: Check the inverter display. Read the error codes, power output, and any warning lights directly on the inverter face. This confirms what the monitoring app is showing. A discrepancy here usually means the monitoring system, not the panels, is the problem.
Step 5: Document the pattern. Track production at the same time of day for a week. If the drop is steady, it is probably equipment. If it varies wildly, weather or shading is more likely. A steady 20% drop on clear days for two weeks is a clear sign of a fault.
Why Solar Output Drops in the Afternoon and What You Can Do
Afternoon production drops are so common they deserve their own section. If your output falls off a cliff after 2 p.m. even on clear days, one of these four issues is usually to blame. The pattern is distinctive: production is normal in the morning, peaks around noon, then drops sharply while the sun is still high.
Heat reduces panel voltage. Panels lose efficiency as they get hotter. A rooftop array in Phoenix can be 50 degrees hotter than ambient air, which costs several percentage points of output. By mid-afternoon, panels have absorbed hours of heat and operate far below their rated efficiency.
Inverter overheating. Inverters throttle down when their internal temperature gets too high. If your inverter is in direct afternoon sun with poor ventilation, it may be shutting off output to protect itself. Moving the inverter to a shaded wall or adding a small fan to its enclosure often fixes this.
High grid voltage forces shutdowns. On sunny afternoons, the grid can become saturated with solar power, raising voltage above the inverter’s acceptable range. The inverter then disconnects to protect your equipment. This is a utility-side issue that requires a technician to adjust settings.
Panel-level mismatch. When one panel in a string produces less than the others, the whole string drags down. Mismatch becomes worse as the afternoon sun hits panels at less-than-ideal angles. Microinverters or DC optimizers solve this entirely by isolating each panel.
Improving airflow around the inverter and ensuring proper panel-to-inverter sizing can help. Talk to your installer about adjusting the inverter’s voltage window if grid-side shutdowns are the cause. In some cases, a simple firmware update from the manufacturer resolves afternoon drops caused by overly conservative grid settings.
When Your Installer Disappears: Orphaned Solar System Help
This is a problem more homeowners are running into, and most guides barely mention it. An orphaned system is one where the original installer has gone out of business and cannot service the equipment. Warranty claims become harder and finding a qualified technician gets complicated.
According to industry estimates, more than 100,000 solar systems in California alone are now orphaned because their installers went bankrupt during the boom and bust cycles of the last decade. If you are in this situation, you are not alone, and there are real paths forward.
Here is what I tell people in this situation. First, gather all your original paperwork, including the equipment serial numbers, model numbers, and warranty documents. Second, contact the panel and inverter manufacturers directly. Most major brands honor their warranties regardless of installer status, and they can often recommend a local certified technician.
Third, look for regional solar service companies that specialize in taking over orphaned systems. In California especially, several firms focus exclusively on this market. Fourth, check with your state’s contractor licensing board for complaints against the original installer and any pending class-action settlements that might cover your situation.
When to Call a Professional for Solar Panel Issues
Some drops are safe to troubleshoot yourself. Others require a licensed professional, and waiting too long can void warranties or create safety hazards. Knowing the difference protects both your system and your family.
Call a professional immediately if you see: burn marks, melted components, a burning smell, sparking, or exposed wiring. These are fire risks and the system needs to be powered down before anyone goes on the roof. Most inverters have an emergency shutdown switch that cuts AC and DC output within seconds.
Schedule a service visit if: production has dropped more than 15% without an obvious cause, error codes persist after a restart, the inverter is more than 10 years old, or you cannot safely access the panels for cleaning. A typical diagnostic visit costs $150 to $300, and many companies apply that fee toward the repair if you proceed.
DIY is fine for: cleaning reachable panels, trimming nearby vegetation, restarting inverters after a storm, and basic monitoring app troubleshooting. Anything that involves opening the inverter, working on the roof, or handling wiring should be left to a licensed electrician with solar experience.
When hiring, ask whether the technician is certified by your inverter manufacturer (Enphase, SolarEdge, SMA, and Fronius all have programs). Manufacturer-certified techs diagnose faster and their work preserves your warranty. Also ask for proof of insurance and a copy of their electrical contractor’s license.
Prevention and Maintenance: Keep Production Steady Year After Year
The best way to avoid drops is to stay ahead of them. I recommend a simple annual routine that takes a few hours but saves thousands over the system’s life. Most homeowners who follow this routine report production within 2% of expected output even after 10 years.
Clean panels once a year. In dry or dusty areas, twice a year is better. Schedule cleanings in late spring after pollen season and after major dust events. Use deionized water if possible to avoid mineral deposits, and never use abrasive cleaners or pressure washers on the glass.
Manage vegetation. Trim trees before they reach the point of shading panels. A small pruning today prevents a major redesign tomorrow. Most tree species grow 2 to 4 feet per year, so plan a check every spring as the leaves come in.
Track inverter lifespan. String inverters typically need replacement around year 10 to 15. Microinverters and optimizers last longer but still fail eventually. Budget for replacement before it catches you off guard. Setting aside $100 to $200 per year in a “solar maintenance fund” covers most eventualities.
Watch the monitoring app weekly. Five minutes a week is enough to spot a trend before it becomes a crisis. Most apps let you set alerts for underperformance. Look at the rolling 7-day average rather than single days, since weather causes a lot of daily noise.
Schedule a professional inspection every 3 to 5 years. A technician can spot loose connectors, early-stage degradation, and ventilation issues before they cause production drops. The cost is usually a few hundred dollars and can be folded into a routine service plan with most installers.
Frequently Asked Questions
What is the 33% rule in solar panels?
The 33% rule is a rough guideline that your solar system should produce about 33% of its rated capacity per day on average across the year. For example, a 10 kW system should produce around 80 kWh on a typical day. Actual output varies with season and weather, but the 33% figure helps you spot when something is off.
What can cause my solar production to suddenly drop in the middle of day?
Sudden midday drops usually come from one of four causes: new shading from clouds or buildings, inverter overheating that triggers throttling, high grid voltage forcing the inverter to disconnect, or a panel-level mismatch from a failing component. Check your inverter display for error codes and your monitoring app for weather-adjusted expected output to narrow it down.
How do I know if my solar panels are producing?
Check three places: your inverter display should show active power output in kilowatts, your monitoring app should show current and historical production, and your electric meter should spin backwards (or register credits) when production exceeds use. If all three show activity during daylight hours, your system is producing normally.
What is the 20 rule for solar panels?
The 20% rule is a sizing guideline for solar inverters. Your inverter’s capacity should be roughly 80% to 100% of your array’s total DC rating, meaning a 10 kW array typically pairs with an 8 to 10 kW inverter. Sizing below 80% causes clipping losses where the inverter caps output, while sizing above 100% can waste inverter capacity.
Key Takeaways on Solar Panel Production Drops
Catching a solar panel production drop early protects the financial return on your system. Start by understanding the difference between normal seasonal variation and a real fault, then work through the nine most common causes. Soiling, new shading, and inverter issues account for most of the drops I see, but NEM billing changes and orphaned systems are increasingly common pitfalls that catch homeowners off guard.
If you take one thing from this guide, take this: spend five minutes a week looking at your monitoring app. Trends are far easier to diagnose than single-day snapshots, and you will catch problems before they cost you real money. When something does look off, run through the diagnostic steps above before paying for a service visit. Most drops have a simple cause, and now you know how to find it.
Your solar system is a long-term investment, and the small habits you build today will keep it performing for decades. Whether you are trying to spot a production drop right now or just want to prevent one in the future, the same principle applies: pay attention, document what you see, and act early when numbers move in the wrong direction.