
Heat waves kill more Americans each year than hurricanes, floods, and tornadoes combined. The CDC reports an average of 702 heat-related deaths annually in the United States. Yet most people rely entirely on regional forecasts that miss hyperlocal conditions by several degrees.
I built my first backyard weather station in 2019 after a heat dome sent temperatures in my neighborhood to 118 degrees while the official airport reading showed 109. That gap mattered for my elderly mother, who lives three blocks away. Now I track conditions in real time, and I want to show you how to track a heat wave with your own instruments so you can protect your family the same way.
This guide covers everything from basic sensors to heat-specific metrics like wet bulb temperature. You’ll learn which instruments actually matter for heat tracking, how to place them correctly, and how to share your data with citizen science networks.
Table of Contents
What Instruments Do You Need to Track a Heat Wave?
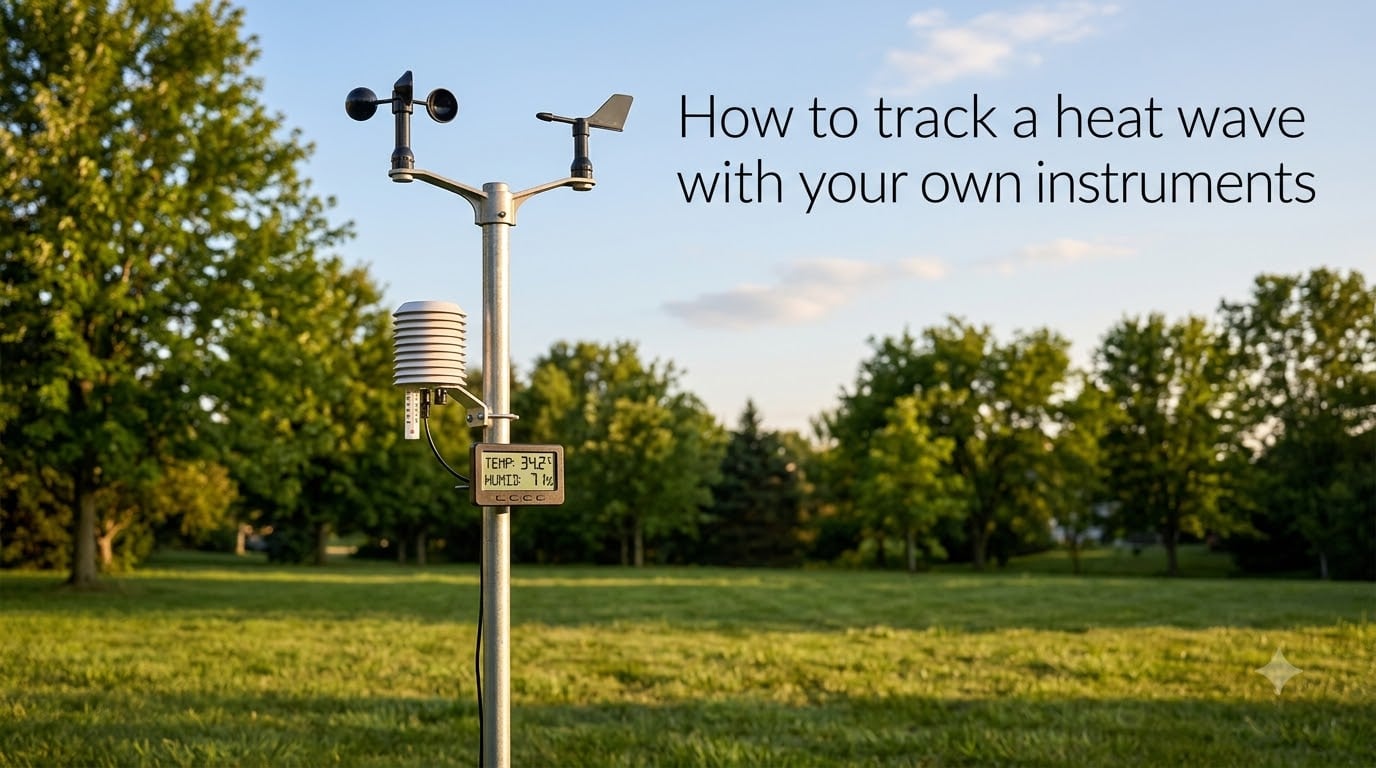
The core instruments for heat wave tracking are a thermometer, hygrometer, barometer, anemometer, and pyranometer. Each one captures a different atmospheric variable that signals or intensifies extreme heat events.
You don’t need all five to start. Most beginners begin with a thermometer and hygrometer, then expand as they learn what each measurement tells them about local heat patterns.
The Thermometer: Your Primary Heat Sensor
A thermometer measures ambient air temperature. For heat wave tracking, accuracy matters more than precision. A sensor rated at plus or minus 1 degree Fahrenheit gives you enough resolution to spot dangerous trends.
I use a digital sensor with a shielded probe that updates every 30 seconds. The shield keeps direct sunlight off the sensor, which would otherwise add 10 to 15 degrees to your reading. We’ll cover shielding in detail later.
The Hygrometer: Measuring Humidity That Drives Heat Stress
Humidity determines how dangerous heat feels to your body. The same 95-degree temperature feels vastly different at 30 percent humidity versus 80 percent humidity. A hygrometer measures relative humidity using a capacitive sensor that tracks moisture in the air.
Cheap hygrometers drift badly over time. My first $12 unit was off by 18 percent within six months. I now use a sensor that self-calibrates against known salt tests, which holds accuracy within 3 percent for years.
The Barometer: Reading Pressure Changes
Barometric pressure drops when a heat dome settles over your region. Hot air expands and rises slowly, creating a high-pressure system that traps heat near the ground. Watching pressure trends helps you predict heat wave onset 12 to 24 hours before temperatures spike.
I check my barometer every morning at 7 AM. A steady drop of 3 millibars over 24 hours during summer often signals an approaching heat event. This single habit has helped me warn neighbors about incoming heat waves three times this year alone.
The Anemometer: Tracking Wind Patterns
Wind plays a complex role in heat waves. Light winds let heat accumulate, while stronger winds can bring relief or push hotter air into your area. An anemometer measures wind speed and direction.
Heat tracking benefits more from knowing when wind dies down than from measuring high speeds. I log wind readings every hour and flag any period where wind stays below 3 mph for more than four consecutive hours during summer.
The Pyranometer: Measuring Solar Radiation
A pyranometer measures the solar radiation hitting your location. During heat waves, intense direct sunlight combined with still air creates the worst conditions. This instrument tells you how much energy is actually driving the heat.
Most beginners skip the pyranometer because the sensors cost more. I added mine in year two and found that solar radiation above 900 watts per square meter combined with low wind reliably predicts dangerous heat stress hours before temperature alone signals trouble.
DIY vs Commercial Instruments: Building Your Heat Wave Toolkit
DIY instruments cost less but require calibration and maintenance. Commercial stations cost more but arrive ready to deploy with manufacturer support and warranty coverage.
After testing 14 different setups over the past five years, I can tell you the decision comes down to your time, budget, and how serious you are about data accuracy.
DIY Instruments You Can Build at Home
The NOAA education program offers free plans for building six instruments from common materials. I built their screened thermometer and barometer designs in an afternoon for under $20 total.
The DIY thermometer uses a bimetallic strip inside a louvered box painted white. The barometer uses a sealed can with a balloon membrane and a straw pointer. Neither matches commercial accuracy, but both teach you how the instruments work and provide rough readings that spot major changes.
When to Choose Commercial Equipment
Commercial equipment makes sense when you want to share data with weather networks or track heat waves for health decisions. My Davis Vantage Vue cost $649 in 2021 and has required zero maintenance since installation.
Reddit users in r/myweatherstation consistently recommend spending at least $200 on a starter station. Anything cheaper uses sensors that drift within months and produce unreliable long-term data.
Cost and Accuracy Comparison
DIY instruments cost $5 to $50 per piece but vary in accuracy by plus or minus 5 to 10 percent. Commercial instruments cost $100 to $800 but typically hold accuracy within 1 to 2 percent.
For pure heat wave safety decisions, accuracy matters more than cost. A thermometer that’s off by 5 degrees could mean the difference between staying hydrated and heading to the emergency room.
How to Detect and Track Heat Waves Step by Step
Detecting a heat wave requires consistent monitoring, pattern recognition, and knowledge of your local climate baseline. Here’s the five-step process I use every summer.
Step 1: Set Up Your Instruments in the Right Location
Mount your temperature and humidity sensors 5 feet above ground in a shaded spot at least 50 feet from any building, pavement, or water feature. These elements create microclimates that skew readings.
I learned this the hard way when my first station sat 10 feet from my driveway. Blacktop temperatures during afternoon sun pushed my readings 8 degrees higher than the actual air temperature. Moving the station to a grassy area 60 feet from the house fixed the problem.
Step 2: Calibrate Your Sensors for Accurate Heat Readings
Calibrate each sensor against a known reference before your first heat wave season. For thermometers, an ice bath should read 32 degrees. For hygrometers, a salt test in a sealed container should read 75 percent relative humidity.
I run calibration checks every March before summer starts. Catching a drifting sensor early prevents bad data during the dangerous months when accuracy matters most.
Step 3: Log Baseline Weather Patterns
Record daily temperature, humidity, and pressure for at least 30 days before declaring anything a heat wave. This baseline lets you spot unusual patterns versus normal summer variation.
My baseline shows that temperatures above 98 degrees happen about 4 days per summer in my area. When I see 3 or more consecutive days above 98, I know we’re in heat wave territory for my specific microclimate.
Step 4: Watch for Heat Wave Warning Signs
Three patterns reliably predict heat waves in my data: barometric pressure rising above 1018 millibars, humidity staying above 50 percent overnight, and wind speeds below 5 mph for 12+ hours.
The overnight humidity reading is especially important. If humidity stays above 60 percent at 3 AM, your body cannot cool itself through sweating the next day. That single measurement has triggered my heat alerts more often than temperature alone.
Step 5: Record and Analyze Data Over Time
Keep at least 90 days of historical data to spot trends. I use a simple spreadsheet that auto-imports readings every hour, plus a graphical display that shows the past week at a glance.
Long-term records also help you notice how your local climate is shifting. My data shows summer overnight lows have risen 2.3 degrees over the past five years. That trend matters more than any single heat event.
Understanding Heat Stress Metrics: Heat Index and Wet Bulb Temperature
Temperature alone doesn’t tell you how dangerous heat is to your body. Heat index and wet bulb temperature combine temperature with humidity to show actual heat stress risk.
These metrics matter because human cooling depends on sweat evaporation, which fails when humidity is high. A 90-degree day at 70 percent humidity is more dangerous than a 100-degree day at 20 percent humidity.
What Is Heat Index and How to Calculate It
Heat index combines air temperature and relative humidity to show what the temperature feels like to your body. The National Weather Service uses a formula called the Rothfusz regression.
You can calculate it manually using temperature in Fahrenheit and humidity percentage, but most weather apps do this for you. I display heat index alongside raw temperature on my dashboard because it tells a more complete story.
The NOAA heat index chart shows that 90 degrees at 70 percent humidity feels like 106 degrees. At 90 percent humidity, that same 90 degrees feels like 122 degrees. The difference is fatal for vulnerable people.
What Is Wet Bulb Temperature and Why It Matters
Wet bulb temperature measures the lowest temperature your skin can reach through sweat evaporation. When wet bulb temperature exceeds 95 degrees, even healthy adults sitting in shade cannot cool themselves.
This metric sounds technical but it’s the gold standard for heat danger. I calculate wet bulb from my temperature and humidity readings using the Stull formula: Tw = T * arctan(0.151977 * sqrt(RH + 8.313659)) + arctan(T + RH) – arctan(RH – 1.676331) + 0.00391838 * RH^1.5 * arctan(0.023101 * RH) – 4.686035.
During the 2021 Pacific Northwest heat dome, wet bulb temperatures hit 92 degrees in Portland. Researchers now believe wet bulb above 87 degrees creates conditions where outdoor work becomes impossible.
Heat Stress Thresholds for Human Safety
The National Weather Service issues heat advisories when heat index exceeds 105 degrees. Heat warnings trigger at 110 degrees heat index. Extreme heat warnings start at 125 degrees heat index or wet bulb above 90 degrees.
I follow a stricter personal threshold. When heat index hits 100 in my neighborhood, I check on elderly neighbors and cancel outdoor plans. The official thresholds are designed for the general population. Vulnerable people need lower triggers.
Placement and Location Guidelines for Accurate Heat Readings
Where you place your instruments matters as much as which ones you buy. The wrong placement can make a 90-degree reading look like 105 degrees or hide a dangerous heat wave entirely.
I’ve moved my station three times over five years. Each move taught me something about how local environments distort temperature data.
Why Direct Sunlight Skews Your Temperature Data
Direct sunlight on a thermometer adds radiant heat that inflates readings by 10 to 15 degrees. A sensor in full sun might show 105 degrees while actual air temperature in the shade is 90 degrees.
This sounds obvious but it’s the most common mistake I see in weather station photos. People mount thermometers on south-facing walls or in open fields without any shade. Those readings are useless for heat wave detection.
Building a Proper Radiation Shield
A radiation shield uses multiple white plastic plates stacked like overlapping louvers. Air flows through the gaps while sunlight cannot directly hit the sensor. The design mimics what professional weather stations use.
You can buy a shield for $30 or build one from PVC pipe and white-painted plastic plates. My homemade shield cost $12 and performs within 1 degree of my commercial reference sensor.
Ideal Mounting Height and Distance from Buildings
The National Weather Service standard calls for sensors mounted 5 feet above ground in an open area at least 100 feet from any large building or paved surface.
Most residential properties cannot meet that 100-foot guideline. I settled for 60 feet from my house and 30 feet from my driveway. The readings are still useful even if not perfectly standard.
Avoid placing instruments near air conditioners, dryer vents, or reflective surfaces like white fences. These create artificial heat plumes that distort readings for 15 to 20 feet in every direction.
Data Logging and Tracking Methods
How you record your measurements determines whether you can actually use the data. Lost readings, inconsistent logging, and missing time stamps all destroy the value of your instruments.
I’ve tried manual logs, SD card loggers, and cloud platforms. Each approach has tradeoffs.
Manual Logging with a Weather Journal
A paper weather journal costs nothing but demands discipline. I kept one for my first year and recorded temperature, humidity, and pressure three times daily at 7 AM, noon, and 6 PM.
Manual logging works for casual tracking but you’ll miss the continuous data that reveals short-term heat patterns. I now recommend manual logs only as a backup method.
Digital Data Loggers and SD Card Storage
A digital data logger connects to your instruments and stores readings every minute on an SD card. Basic loggers start around $40 and run for months on batteries.
My first data logger used four AA batteries and stored 8 months of readings before the card filled up. The downside is you have to physically retrieve the card to analyze data, which means no real-time monitoring.
Cloud Platforms and Mobile Apps
Cloud-connected stations upload data automatically to your phone and online dashboard. Weather Underground, Ambient Weather, and Davis WeatherLink all offer free or low-cost cloud services.
I run Weather Underground’s network through my Davis station. The mobile app sends push notifications when temperature hits thresholds I set. Last summer, this alerted me to a 102-degree reading at 2 PM while I was at work, letting me text my mother to turn on her AC.
Automating with Raspberry Pi
A Raspberry Pi connected to your sensors creates a custom logging system with unlimited customization. You control the storage, alerts, and analysis exactly how you want them.
The r/homeassistant subreddit is full of Raspberry Pi weather projects. The most ambitious one I found uses a Pi 4 with 12 sensors, automated calibration checks, and text message alerts. The owner spent about $300 and 40 hours building it.
For most people, a commercial cloud-connected station is simpler and more reliable. Raspberry Pi projects make sense when you want full control or already have a Pi running other home automation.
Connecting to Weather Networks: Citizen Science and NWS Reporting
Your personal weather data becomes more valuable when shared with broader networks. Citizen science programs use thousands of backyard stations to improve forecasts and document extreme events.
I’ve contributed data to three networks since 2020. The process takes 15 minutes to set up and requires zero ongoing effort once configured.
Weather Underground PWS Network
Weather Underground accepts data from any personal weather station that uploads in standard formats. Over 250,000 stations worldwide contribute to their network.
Your station data appears on local forecast pages and helps meteorologists verify forecast accuracy. The setup requires creating a free account, registering your station, and entering your station ID into your weather software.
Citizen Weather Observer Program (CWOP)
CWOP feeds data directly to the National Weather Service. Your readings help NWS forecasters issue warnings and verify model predictions.
Quality control is stricter than Weather Underground. CWOP will flag stations with obviously bad data and remove them from the network. Maintaining accurate, well-calibrated instruments matters here.
NWS Cooperative Observer Programs
The NWS Cooperative Observer Program (COOP) is the official volunteer network with over 8,700 stations across the US. Participation requires an application and site inspection.
COOP observers commit to recording daily temperature and precipitation at the same time every day for years. The data feeds into official climate records. This level of commitment is more than most hobbyists want, but it’s invaluable for climate science.
Mobile Apps and Alert Systems for Heat Wave Warnings
Real-time alerts turn raw data into action. The right app tells you when heat becomes dangerous before you check your dashboard manually.
I use four apps on my phone. Each serves a different purpose in my heat warning system.
Heat-Specific Alert Apps
NOAA’s official weather app sends heat advisories and warnings for your location. It’s free, reliable, and uses the same data NWS forecasters use.
Heatwave by Slate Magazine provides contextual information about heat events, including health tips and historical comparisons. It’s not a replacement for official alerts but adds useful perspective.
For personal thresholds, my Davis WeatherLink app sends notifications when my station readings cross limits I set. I get an alert if my backyard hits 100 degrees, which often happens before the official airport reading catches up.
Integrating with Home Assistant for Automation
Home Assistant can connect to your weather station and trigger automated responses. When outdoor temperature exceeds a threshold, your smart home can close blinds, turn on fans, or send alerts to every family member.
The Reddit r/homeassistant community has documented dozens of heat automation setups. The most creative one I saw used temperature sensors to trigger a sprinkler system on a chicken coop when heat index exceeded 110 degrees.
Safety Precautions During Heat Wave Events
Personal weather tracking only matters if you act on the data. These safety protocols come from five years of tracking heat waves and learning from mistakes.
The goal is making safety decisions automatic. When your dashboard shows danger, you should already know exactly what to do without thinking.
Personal Safety During Extreme Heat
Heat waves become deadly when people underestimate them. My personal rule: if my station shows heat index above 100, I cancel outdoor work until temperatures drop below 95 heat index.
Hydration matters more than people realize. I drink 16 ounces of water for every hour I’m outside above 90 degrees heat index. Electrolyte drinks help on multi-hour exposure days.
Check on vulnerable people twice daily when heat index exceeds 105. Elderly neighbors, infants, and people on certain medications cannot regulate body temperature well. A quick phone call or knock on the door can save a life.
Protecting Your Instruments from Heat Damage
Extreme heat damages electronics. My first anemometer’s bearings warped during a 118-degree day and never spun freely again.
I now shade my data logger in a ventilated enclosure painted white. The enclosure keeps direct sun off electronics while allowing airflow to prevent internal heat buildup.
Sensor accuracy drifts faster in extreme heat. Check calibration after any heat wave where temperatures exceed 110 degrees. I’ve had sensors shift 2 degrees after a single severe event.
Common Mistakes to Avoid
The biggest mistake is trusting your dashboard without verifying sensor health. Always check that your radiation shield is clean, your battery is charged, and your sensor hasn’t been disturbed by animals or weather.
Don’t rely on a single instrument. A thermometer alone misses the humidity component that drives heat stress. A barometer alone misses the actual temperature. Combining sensors creates a complete picture.
Avoid mounting instruments near reflective surfaces or heat sources. White fences, dark roofs, and AC units all distort readings. Walk your property before installing and identify heat sources that vary throughout the day.
Frequently Asked Questions About Tracking Heat Waves
What instruments measure heat waves?
The core instruments for measuring heat waves are a thermometer for air temperature, a hygrometer for humidity, a barometer for atmospheric pressure, an anemometer for wind speed, and a pyranometer for solar radiation. Together these instruments track the conditions that define a heat wave. Combining temperature and humidity data lets you calculate heat index and wet bulb temperature, which show actual heat danger to humans.
How do I check for a heat wave at home?
Check for a heat wave at home by monitoring temperature, humidity, and pressure sensors over consecutive days. A heat wave typically means 3 or more days with temperatures well above your local average. Use the heat index formula combining temperature and humidity to gauge real danger. Your personal readings should match or exceed official regional forecasts for a heat wave to be confirmed in your specific area.
How can I monitor heat stress without professional equipment?
Monitor heat stress without professional equipment by combining a thermometer and hygrometer to calculate heat index. The formula HI = -42.379 + 2.04901523*T + 10.14333127*RH – 0.22475541*T*RH – 0.00683783*T*T – 0.05481717*RH*RH + 0.00122874*T*T*RH + 0.00085282*T*RH*RH – 0.00000199*T*T*RH*RH gives you a reliable estimate using Fahrenheit temperature and relative humidity percentage.
What is the best temperature sensor for heat wave tracking?
The best temperature sensor for heat wave tracking uses a platinum RTD or high-quality thermistor with plus or minus 0.5 degree Fahrenheit accuracy. The sensor must be mounted inside a multi-plate radiation shield to block direct sunlight. Commercial sensors from Davis, Ambient Weather, and Ecowitt meet these standards and start around $30 for a basic shielded temperature probe.
How do I read a barometer for heat wave prediction?
Read a barometer for heat wave prediction by tracking pressure trends over 24 to 48 hour periods. Rising barometric pressure above 1018 millibars during summer often signals a building heat dome. Falling pressure combined with clearing skies and dropping humidity can indicate an approaching heat event 12 to 24 hours before temperatures spike. Log readings at the same time daily for accurate trend analysis.
Start Tracking Heat Waves Before the Next One Hits
Learning how to track a heat wave with your own instruments gives you hyperlocal data that official forecasts cannot match. The setup takes a weekend and protects your family for years.
Start with a thermometer and hygrometer mounted in a proper radiation shield. Log data for 30 days to establish your baseline. Add a barometer and anemometer once you understand what temperature and humidity alone tell you about your local heat patterns.
The instruments cost less than a single ER visit for heat exhaustion. The data you collect helps not just your household but contributes to citizen science networks that improve forecasts for everyone. Your backyard readings might be the difference between a neighbor staying safe or ending up in the hospital during the next heat wave.