
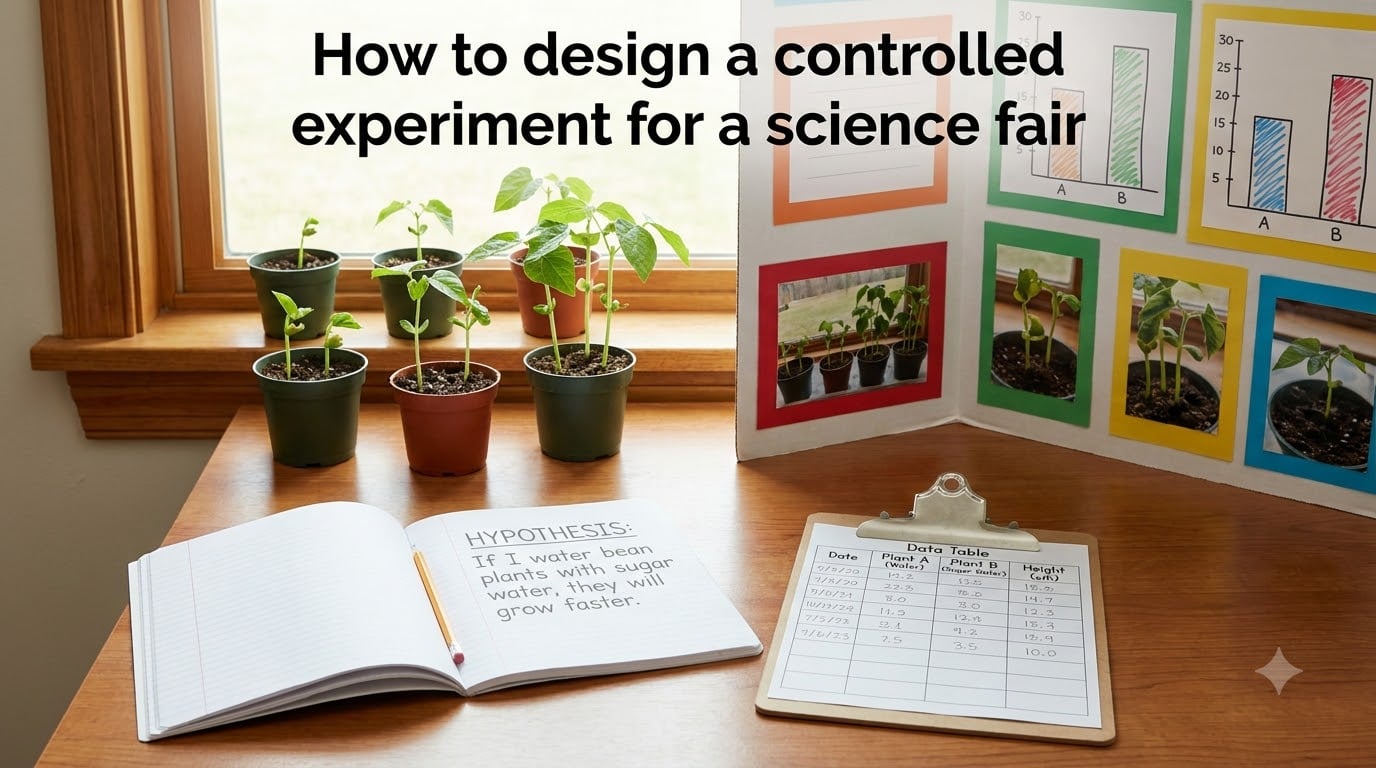
Every year, our team at March for Science SV hears the same question from students walking up to our outreach booth: “How do I actually design an experiment that proves something?” That question is the heart of every great science fair project. This guide breaks down exactly how to design a controlled experiment for a science fair, so you can walk into judging day with real data, a clear question, and a presentation that shows you did the work yourself.
A controlled experiment is the single most powerful tool in your science fair kit. It lets you isolate one cause and measure one effect, which is what separates a true experiment from a cool demo. In the next ten minutes, we’ll walk through the seven steps that turn a spark of curiosity into a project worthy of a medal.
Table of Contents
What Is a Controlled Experiment?
A controlled experiment is a scientific test done under controlled conditions where only one variable is changed at a time. By holding every other factor constant, you can confidently link the change you made to the result you measured. This is the only reliable way to show cause and effect, which is why judges weigh controlled experiments so heavily.
Here are the five components of a controlled experiment that appear in every strong science fair project:
- Testable question — a question you can answer with measurements.
- Hypothesis — your predicted answer, written before you start.
- Independent variable — the one factor you change on purpose.
- Dependent variable — the one factor you measure to see if it changed.
- Controlled variables — every other factor you keep the same, plus a control group for comparison.
If you can name these five elements in your own project, you have a controlled experiment. If you cannot, you likely have an observation or a demonstration instead, and that’s a different category at most fairs.
The 7 Steps of the Scientific Method
The scientific method is the recipe behind every controlled experiment. Think of it as seven checkpoints. Each one builds on the last, and skipping ahead usually leads to flawed data. Our team has walked dozens of students through this exact sequence at workshops, and the projects that follow all seven steps almost always outperform the ones that skip ahead.
- Ask a testable question about something you can actually measure.
- Form a hypothesis using an “if-then” prediction.
- Identify your variables — independent, dependent, and controlled.
- Design your experiment, including sample size and number of trials.
- Conduct the experiment and record data in a science notebook.
- Analyze your data with tables and graphs.
- Draw a conclusion that addresses your original hypothesis.
We’ll go through each step in detail below. Keep a notebook open as you read so you can start drafting your own project in real time.
Step 1: Ask a Testable Question
A testable question is one you can answer with an experiment, not with an opinion. The easiest way to write one is to fill in the blank: “How does ______ affect ______?”
For example, “How does the amount of sunlight affect how fast a bean plant grows?” is testable. “Are plants cool?” is not. The first question produces numbers you can measure; the second produces a vibe.
Here are three rules our team uses when vetting student questions at the SV science fair:
- The answer must be measurable with a tool you already own or can borrow.
- The test must be repeatable by someone else using your method.
- The question should fit inside the time and budget you actually have.
Step 2: Form a Strong Hypothesis
A hypothesis is your best guess about the answer, written before you run the experiment. The classic format is “If [I change this], then [this will happen], because [why you think so].” The “because” part is what separates a real hypothesis from a guess.
For the plant question, a strong hypothesis looks like: “If I increase the daily sunlight exposure for bean plants from 2 to 6 hours, then the plants will grow taller after 3 weeks, because plants need light for photosynthesis.” That same student could also write a null hypothesis: “If I change the sunlight, then plant height will not change.” The null hypothesis is what your data actually has to defeat in order to support your original idea.
A good hypothesis is specific, testable, and grounded in prior research. Spend 15 minutes reading what others have found. That background reading is what judges want to see in your “Research” section.
Step 3: Identify Your Variables
Variables are the moving parts of your experiment. Get these right and the rest of the project almost writes itself. Get them wrong and no amount of data will save you.
Independent variable — the one thing you change. In the plant study, that’s hours of sunlight per day.
Dependent variable — the one thing you measure. Plant height in centimeters after 3 weeks.
Controlled variables — everything you keep the same. Water amount, soil type, pot size, room temperature, plant species, and starting height all count. Write these down explicitly so a judge can see you thought about them.
You also need two groups. The experimental group receives the change you are testing. The control group gets the standard treatment with no change. Comparing the two groups is what makes your experiment “controlled.” Without a control group, you cannot prove your change caused the result.
Step 4: Design Your Experiment and Choose Sample Size
Now you plan the Logistics — materials, timeline, and most importantly, how many test subjects you need. Sample size is the part most students underestimate, and it’s the part judges look at first.
For a middle or high school science fair, we recommend at least 10 subjects per group and 3 trials per subject. That gives you 30 data points per condition, which is enough to spot a real trend without turning your kitchen into a greenhouse.
Multiple trials matter because no single run is perfect. If you tested one plant and it died, you could blame your variable or you could blame bad luck. Three trials per subject let you separate signal from noise, which is the whole point of replication.
Before you start, write a procedure so detailed that another student could repeat it without asking you a single question. List every material, every measurement, and every step. Judges love this section because it proves your experiment is repeatable, and that’s the bedrock of real science.
Step 5: Conduct the Experiment and Record Data
This is the fun part. Set up your materials, run your procedure, and write everything down in a bound science notebook. Do not use loose paper. A bound notebook with dated, signed entries is the gold standard for science fairs because it shows your work happened in real time.
As you record, you’ll collect two kinds of data. Quantitative data is anything you can measure with a number: height in centimeters, temperature in degrees, time in seconds. Qualitative data is anything you describe with words: leaf color, texture, smell. Both are useful, but judges want to see at least some quantitative data because it can be graphed and analyzed.
Our team has seen too many students skip the notebook and try to reconstruct data at the end. Judges can spot it. Write it down as it happens, and include any unexpected observations — those often become the most interesting part of your conclusion.
Step 6: Analyze Data and Draw Conclusions
Once your experiment is done, put your numbers into a table and then turn them into a graph. Bar graphs work well for comparing groups, line graphs work well for change over time, and scatter plots work well for showing a relationship between two measured variables. Pick the chart that matches the story your data tells.
Look for patterns. Did the experimental group consistently score higher, lower, or about the same as the control group? Did the result match your hypothesis, or did the data reject it? Either outcome is a win. A rejected hypothesis is still a valid result, as long as you explain what you learned and why you think it happened.
When you draw your conclusion, return to your original hypothesis and answer it directly. State whether the data supported or rejected it, and suggest one thing you would change if you ran the experiment again. That “next step” line is what separates a complete project from a great one.
Common Science Fair Mistakes and How to Avoid Them
After 12 years of judging and mentoring, our team has seen the same handful of mistakes sink otherwise promising projects. Here’s what to watch for, and how to dodge each one.
Mistake 1: Changing more than one variable. If you change sunlight and water at the same time, you cannot tell which one caused the plant to grow. Pick one variable and stick to it.
Mistake 2: Skipping the control group. Without a control group, you have nothing to compare against. Always run a control alongside your experimental group.
Mistake 3: Using too few test subjects. One trial gives you an anecdote. Ten trials give you data. Aim for at least 10 subjects per group and 3 trials each.
Mistake 4: “Overdone” projects without a twist. Volcanoes, baking soda volcanoes, and salt-and-ice experiments are not bad, but judges have seen hundreds of them. Add an original twist — a new variable, a new measurement, a new context — and your project stands out.
Mistake 5: Letting parents do the work. Judges can spot an adult-written report a mile away. Own the project yourself. Ask for guidance, not ghostwriting.
Mistake 6: Faking or “cleaning up” data. Real data is messy. If a trial failed, record it and explain why. Honest mistakes are far more respected than suspiciously perfect numbers.
Science Fair Presentation Tips
Your experiment is only half the project. The other half is communicating it. A clear presentation can lift a good project to great, and a confusing one can sink a strong design.
Start your display board with the question and the hypothesis in the top third. Judges should be able to read your core idea in under 10 seconds. Place your data tables and graphs in the middle, and reserve the bottom for your conclusion and next steps.
Bring your science notebook to the judging table. Point to specific entries when you answer questions. Be ready to explain your choice of variable, your sample size, and one surprise you encountered. That last one — the surprise — is what turns a rehearsed answer into a real conversation.
If your school follows NGSS standards, mention how your project aligns with the practice of “Planning and Carrying Out Investigations.” That single sentence signals to judges that you understand the bigger picture of science, not just your one experiment.
Frequently Asked Questions
How do I design a controlled experiment for a science fair?
Start with a testable question written as u0022How does X affect Y?u0022 Form an if-then hypothesis, identify one independent variable, one dependent variable, and all controlled variables. Set up a control group and an experimental group, run at least 10 subjects per group with 3 trials each, record data in a bound notebook, then analyze and draw a conclusion that directly answers your hypothesis.
What are the 5 components of a controlled experiment?
The five components are: (1) a testable question, (2) a hypothesis, (3) an independent variable you change, (4) a dependent variable you measure, and (5) controlled variables combined with a control group for comparison. Every strong science fair project names all five before collecting any data.
How do I write a strong hypothesis for a science fair project?
Use the format: u0022If I change [independent variable], then [dependent variable] will [predicted result], because [scientific reason].u0022 Make it specific, testable, and grounded in research. You can also write a null hypothesis that predicts no change — that is what your data must actually defeat to support your original idea.
How many test subjects do I need for a science fair experiment?
Use at least 10 subjects per group and run 3 trials per subject, giving you 30 data points per condition. For younger students or shorter projects, 5 subjects per group with 3 trials is the minimum we recommend. Larger sample sizes produce more reliable results and impress judges.
Final Thoughts on Designing a Controlled Experiment for a Science Fair
Designing a controlled experiment for a science fair is really about following seven clear steps: ask, hypothesize, identify variables, design, conduct, analyze, and conclude. Each one feeds the next, and the whole project becomes far less overwhelming once you see it as a sequence rather than a single giant task.
Our team at March for Science SV believes every student can run a real experiment. Pick a question you care about, keep your variables honest, document everything in a notebook, and let the data tell the story. Bring that to your science fair, and the judges will see exactly what we see: a young scientist in the making.