
Every research project, science fair experiment, and data analysis task comes down to one fundamental skill: knowing which variable you control and which one you measure. If you mix them up, your entire experiment falls apart. That is why learning how to identify independent and dependent variables in a project is the single most important step before you collect a single piece of data.
I have spent years working with students, researchers, and project teams who struggle with this exact problem. The good news is that once you understand the underlying cause-and-effect relationship, identifying variables becomes second nature. In this guide, I will walk you through clear definitions, a step-by-step identification process, memory tricks that actually work, and real-world project examples you can apply immediately.
Whether you are designing a science fair project, writing a research proposal, or analyzing survey data, the framework below will help you confidently separate your independent and dependent variables every single time.
Table of Contents
What Are Independent and Dependent Variables?
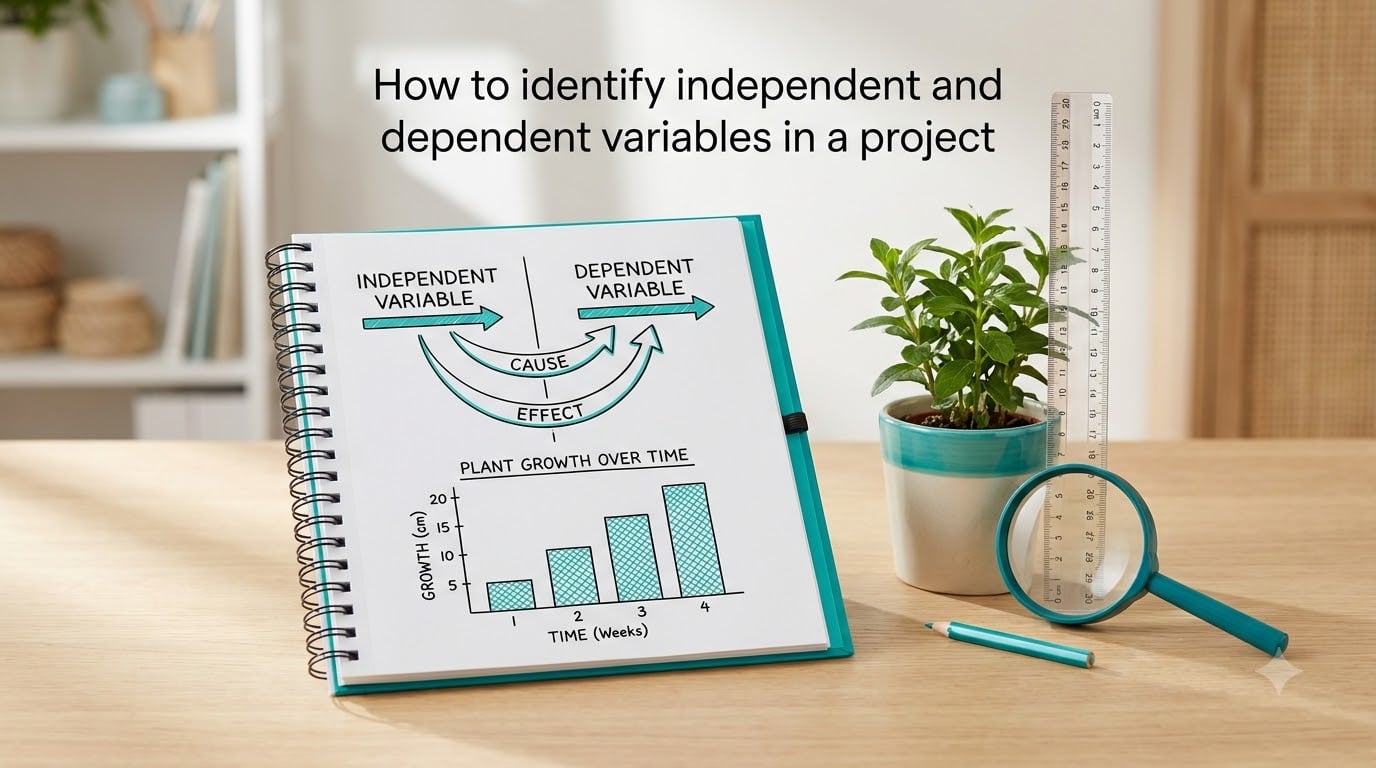
The independent variable is the factor you deliberately change or manipulate in an experiment. It is the cause in a cause-and-effect relationship. As the researcher, you have direct control over this variable. For example, if you are testing how different amounts of sunlight affect plant growth, the amount of sunlight is your independent variable because you decide how much light each plant receives.
The dependent variable is the factor you measure or observe as a result of changing the independent variable. It is the effect. The dependent variable depends on what you changed. In that same plant experiment, the height of the plants is your dependent variable because it depends on how much sunlight the plants received.
There is also a third type you need to know: controlled variables. These are the factors you keep constant throughout the experiment to make sure they do not influence your results. In the plant example, controlled variables would include the type of soil, the amount of water, the plant species, and the temperature. Keeping these factors the same ensures that any change in plant growth is actually caused by the sunlight, not by something else.
Think of it as a simple equation: Independent Variable (cause) leads to Dependent Variable (effect), while Controlled Variables stay fixed so they do not interfere.
Independent vs Dependent Variables: Key Differences
The fastest way to distinguish between these two variable types is to look at who controls them and how they function in the experiment. The independent variable is the input and the dependent variable is the output. One causes change. The other shows the result of that change.
Here is a side-by-side breakdown of how they differ across key dimensions:
Role in the experiment: The independent variable is what you manipulate. The dependent variable is what you measure.
Position on a graph: The independent variable always goes on the x-axis (horizontal). The dependent variable always goes on the y-axis (vertical). Many students mix this up, so commit it to memory now.
Direction of influence: The independent variable influences the dependent variable, never the other way around. The dependent variable responds to changes in the independent variable.
Who controls it: You, the researcher, set the independent variable. Nature or the experiment produces the dependent variable. You do not directly control what the dependent value turns out to be.
Another way to think about it: The independent variable is the “if” part of your hypothesis. The dependent variable is the “then” part. “If I increase the temperature, then the reaction rate will change.” Temperature is independent. Reaction rate is dependent.
How to Identify Independent and Dependent Variables in a Project?
Identifying independent and dependent variables in a project becomes straightforward when you follow a repeatable process. I use this exact five-step method with every research project, and it works whether you are running a controlled lab experiment or analyzing survey data.
Step 1: Write your research question in plain language. Start by stating what you want to find out. For example: “Does the amount of fertilizer affect how tall tomato plants grow?” Having a clear question makes the variables obvious.
Step 2: Find what you will change. Look at your research question and identify the factor you are deliberately altering. In the fertilizer example, the amount of fertilizer is what you change. That is your independent variable.
Step 3: Find what you will measure. Now identify the outcome you are tracking. The height of the tomato plants is what you measure to see if the fertilizer made a difference. That is your dependent variable.
Step 4: List what you will keep the same. Write down every other factor that could influence your results. Same soil type, same water amount, same light exposure, same tomato variety. These are your controlled variables.
Step 5: Run the cause-and-effect test. Ask yourself: “Does variable A cause a change in variable B, or does variable B cause a change in variable A?” The one doing the causing is the independent variable. The one being affected is the dependent variable. If the relationship does not flow in one clear direction, you may need to refine your research question.
For science fair projects, I recommend writing your variables on sticky notes and placing them in three columns labeled “What I Change,” “What I Measure,” and “What I Keep the Same.” This visual approach makes the structure of your experiment instantly clear to judges.
Easy Ways to Remember the Difference
If you keep forgetting which variable is which, you are not alone. This is one of the most common questions I see from students on forums like Reddit’s r/HomeworkHelp and r/ScienceTeachers. Here are the most effective memory tricks I have found.
The “I Change” trick: Independent starts with “I.” Think of it as “I change this variable.” The independent variable is the one you, the researcher, actively control.
The “Depends on” trick: Dependent contains the word “depends.” The dependent variable depends on what you changed. If you are looking at a result that relies on something else happening first, it is the dependent variable.
The cause-and-effect frame: Independent equals cause. Dependent equals effect. Every experiment is a mini cause-and-effect story. Find the cause first, then find the effect.
The DRY MIX acronym: This is a favorite among science teachers. DRY stands for Dependent, Responding, Y-axis. MIX stands for Manipulated, Independent, X-axis. If you remember DRY MIX, you will never put a variable on the wrong axis again.
The “what YOU change” vs “what changes as a result” test: This phrasing, popularized by Reddit users in academic communities, cuts through the confusion. Say each variable out loud in both sentence frames. The one that fits “what YOU change” is independent. The one that fits “what changes as a result” is dependent.
Real-World Project Examples
Theory only gets you so far. Let me walk you through how to identify independent and dependent variables across different types of projects so you can see the pattern in action.
Science fair project (biology): A student wants to test whether different types of music affect how fast mice run through a maze. The independent variable is the type of music (classical, rock, silence, pop). The dependent variable is the time it takes each mouse to complete the maze. Controlled variables include the maze design, the mouse breed, the time of day, and how long the mouse has been without food.
Psychology survey project: A researcher studies whether hours of sleep affect test scores in college students. The independent variable is the number of hours slept. The dependent variable is the test score. Note that in survey research, you are not manipulating the variable directly, but the independent variable is still the factor you believe influences the outcome.
Business and marketing project: A company tests whether changing the color of a “Buy Now” button increases click-through rates on their website. The independent variable is the button color. The dependent variable is the number of clicks. Controlled variables include page layout, product price, traffic source, and the time of day the test runs.
Math and equation context: In the equation y = 3x + 2, x is the independent variable because you choose its value. Y is the dependent variable because its value depends on what x is. When graphing this equation, x goes on the horizontal axis and y goes on the vertical axis.
Observational study (non-experimental): A researcher observes whether communities with more parks have lower obesity rates. The independent variable is the number of parks per capita. The dependent variable is the obesity rate. In observational research, you cannot truly manipulate variables, but the cause-and-effect logic still applies for analysis purposes.
Common Mistakes to Avoid
Even with a solid framework, certain errors trip people up repeatedly. I see these same five mistakes in nearly every project I review. Knowing them ahead of time saves you from costly design flaws.
Mistake 1: Confusing controlled variables with dependent variables. Controlled variables are the factors you keep constant. They do not change at all during the experiment. Dependent variables do change, but their change is the result you are measuring, not something you control. If a factor stays the same throughout, it is controlled. If it changes as an outcome, it is dependent.
Mistake 2: Putting variables on the wrong graph axis. The independent variable always goes on the x-axis. The dependent variable always goes on the y-axis. This is not a preference. It is a scientific convention that every graphing tool and publication follows. Remember DRY MIX to avoid this error.
Mistake 3: Having too many independent variables. If you change more than one thing at a time, you cannot tell which change caused the result. Each experiment should test one independent variable at a time. If you want to study multiple factors, run separate experiments for each.
Mistake 4: Assuming correlation means causation. Just because two variables move together does not mean one causes the other. Ice cream sales and drowning incidents both increase in summer, but one does not cause the other. Temperature is the hidden variable. Always think critically about whether your independent variable truly causes the change in your dependent variable.
Mistake 5: Choosing a dependent variable you cannot measure. Your dependent variable must be something you can quantify or observe objectively. “Happiness” is hard to measure. “Score on a happiness survey from 1 to 10” is measurable. Define your dependent variable in specific, observable terms.
Frequently Asked Questions
How to recognize dependent and independent variables?
Ask yourself two questions: What am I changing? That is your independent variable. What am I measuring as a result? That is your dependent variable. The independent variable is the cause and the dependent variable is the effect. If one factor directly influences the other, the influencer is independent and the response is dependent.
How to identify independent and dependent variables in research example?
In a study testing whether study time affects exam scores, study time is the independent variable because the researcher controls or tracks it, and exam score is the dependent variable because it is the outcome being measured. Write your research question, identify what you manipulate, then identify what you measure.
What’s an easy way to remember independent and dependent variables?
Use the DRY MIX trick: Dependent, Responding, Y-axis and Manipulated, Independent, X-axis. You can also think of the independent variable as ‘I change this’ (independent starts with I) and the dependent variable as ‘depends on what I changed.’
What are 5 examples of independent variables?
Five common examples are: (1) amount of water given to plants, (2) hours of sleep per night, (3) temperature of a chemical reaction, (4) type of fertilizer used, and (5) dosage of a medication. In each case, the researcher chooses or controls the level or category of that variable.
Conclusion
Learning how to identify independent and dependent variables in a project does not require a statistics degree. It requires a clear understanding of cause and effect. The independent variable is what you change. The dependent variable is what you measure. Controlled variables are what you keep the same. That framework applies to every experiment, survey, and research project you will ever design.
Use the five-step identification process whenever you start a new project. Write your research question, find what you change, find what you measure, list what stays constant, and run the cause-and-effect test. Pair that with the DRY MIX memory trick and you will never second-guess yourself again.
Your next step is simple: take the research question for your current project and run it through the five-step process right now. Once you have your variables clearly identified, the rest of your project design, from data collection to analysis, falls into place.