
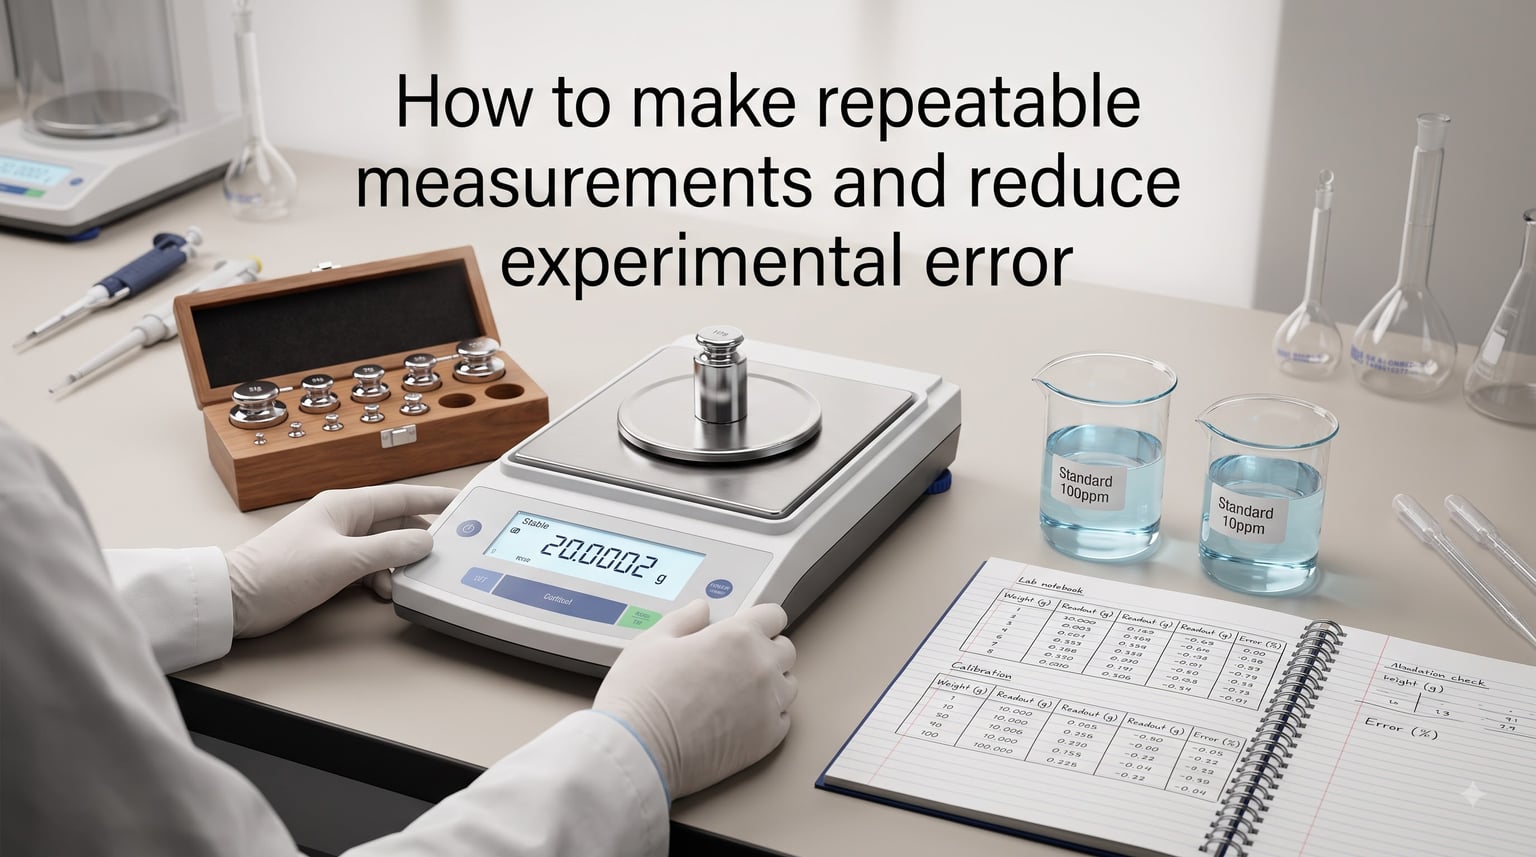
Every measurement carries a fingerprint of uncertainty. When I started doing lab work, I assumed precision came from buying better instruments. After 10 years of running physics and chemistry experiments with our team, I learned the truth: how to make repeatable measurements and reduce experimental error is more about protocol, calibration discipline, and statistical thinking than about gear.
This guide walks through the exact steps our research group uses to shrink uncertainty in real experiments. Whether you are a student writing a lab report or a researcher publishing data, these are the methods that actually move the needle.
Table of Contents
What Is Experimental Error and Why Does It Matter?
Experimental error is the difference between a measured value and the true value of what you are measuring. It is not the same as a mistake. A mistake is a blunder you can fix (misreading a scale, writing down the wrong number). Error is a built-in limitation of every measurement process.
Understanding why this matters starts with one principle: science only works when results can be repeated. If two labs run the same experiment and get wildly different numbers, nobody learns anything. In 2026, reproducibility crises affect roughly 70% of researchers across fields, according to a Nature survey of 1,500 scientists. Most of that failure traces back to poorly controlled measurement error.
Error matters because it sets the ceiling on every conclusion you draw. If your voltage reading has 5% uncertainty, you cannot claim a 2% effect is real. If your pipette delivers 5% more volume than labeled, every concentration you calculate is biased. Reducing experimental error is the path to trustworthy data.
Understanding Systematic Error vs Random Error
Before you can reduce error, you need to know which kind you are fighting. There are two main categories, and they behave completely differently.
Systematic error is a consistent bias that pushes every measurement in the same direction. If your thermometer reads 2 degrees high, every temperature you record is 2 degrees high. Repeating the measurement does nothing. The error stays put because it lives in the instrument, the method, or the setup.
Random error is scatter. Read the same thermometer 10 times and you will get slightly different values due to noise, vibration, parallax, or airflow. Random error can be reduced by repeating measurements and averaging.
Here is a quick comparison to keep straight:
Systematic error: consistent offset, fixed direction, hidden in equipment or method, cannot be removed by repetition alone.
Random error: scatter around the mean, reduced by averaging, follows statistical laws (standard deviation shrinks by 1 over the square root of n).
A physics student on Reddit once bragged about getting 2% error on a pendulum experiment. That kind of result only happens when both systematic and random error are controlled. Most students get 10-15% because they ignore systematic bias.
How to Reduce Systematic Error Step by Step
Reducing systematic error requires detective work. You have to find the bias and fix it at the source. Our team uses this protocol:
Step 1: Calibrate against a known reference. Before any run, measure a certified standard. A weight, a buffer solution, a reference voltage. Whatever your instrument measures, compare it to a traceable standard. If the reading differs, record the offset.
Step 2: Apply the correction. Subtract the offset from every future reading, or recalibrate the instrument so it reads correctly. Cornell’s lab manual recommends a calibration curve when the response is not linear. Plot measured vs known, fit a line, and use it to correct unknowns.
Step 3: Swap instruments or methods. If you suspect bias, measure the same thing with a different tool. Two rulers giving the same wrong length means the error is in your technique, not the ruler.
Step 4: Run a blank or control. Measure the system with no signal present. Any nonzero reading is systematic offset. Subtract it.
Step 5: Document everything. Calibration certificates, reference values, correction factors. Without records, you cannot defend your data.
How to Reduce Random Error Through Repeat Measurements
Random error obeys statistics. If your single measurement has uncertainty sigma, the average of n independent measurements has uncertainty sigma divided by the square root of n. That is why 4 repeats cut error in half and 9 repeats cut it to one-third.
But there are conditions. The repeats must be independent. If you read the same dial three times in a row without resetting the setup, you are measuring the same noise pattern, not new data. Real repetition means resetting, realigning, and re-measuring from scratch.
Here is the practical protocol we follow for repeatable measurements:
Decide your sample size in advance. For 5% precision, you typically need at least 16 measurements. For 1% precision, you need around 100.
Randomize the order to cancel drift effects.
Compute mean and standard deviation after each batch.
Use the standard error of the mean (s over sqrt n) as your uncertainty estimate.
Report both the number of trials and the uncertainty so others can judge the data.
This is why repeating an experiment reduces random error but does nothing for systematic bias. If your ruler is wrong by 1 millimeter, averaging 1,000 readings still gives the wrong answer, just with a tighter spread.
Calibration Techniques That Improve Repeatability
Calibration is the single most powerful tool against systematic error. Three approaches work well across disciplines.
Single-point calibration checks the instrument at one known value. Fast and simple. Best for linear instruments with near-zero offset, like a pH meter in buffer 7.
Two-point calibration uses two known values to define both slope and intercept. Most modern instruments default to this. A conductivity probe calibrated at 0 and 1413 microsiemens per centimeter will track accurately across the full range.
Multi-point calibration with a curve handles nonlinear responses. Measure 5 or more standards across the operating range, plot the response, and fit a polynomial. Cornell’s example of calibrating a bathroom scale with known weights is the classic case where a 3-point curve reveals whether the spring is linear.
Whichever method you choose, follow these rules:
Calibrate before every measurement session, not once per month.
Use certified references traceable to national standards (NIST in the US, equivalent bodies elsewhere).
Recalibrate if environmental conditions change significantly.
Keep a calibration log with date, standard values, instrument reading, and technician initials.
Controlling Environmental and Human Variables
Instruments do not work in a vacuum. Temperature swings, humidity, vibration, and operator inconsistency all inject error. Our team treats the environment as part of the measurement system.
For environmental control, isolate the setup from drafts, direct sunlight, and HVAC vents. A temperature-stable room (within 1 degree Celsius) removes a major source of drift in optical and electrical measurements. For high-precision work, use a vibration-isolated table.
Human error is harder. The biggest contributor is inconsistency between operators and within a single session. I have watched a student’s measured values drift over 8% during a 3-hour lab because they started reading the meniscus differently as fatigue set in.
Three habits cut human error sharply:
Written protocols: step-by-step procedures that anyone can follow without guessing.
Blind measurements: have a second person record values without seeing the display, then compare. This catches transcription errors and reading bias.
Training and rotation: cross-train operators so bias from one person’s technique gets averaged out.
Avoid parallax when reading needles or liquid levels. Position your eye level with the mark, every time. It sounds trivial but it is one of the top three error sources in student labs.
Acceptable Error Thresholds in Real Experiments
How much error is okay? It depends on what you are trying to learn. A 5% measurement is excellent for educational labs and many industrial applications. Cutting-edge physics experiments push below 0.1% to test theoretical predictions.
Here are rough guidelines from common fields:
Intro physics labs: 5-10% is acceptable. Below 2% is outstanding.
Chemistry analytical work: 1-3% is standard for titration and gravimetric analysis.
Biology assays: 5-15% depending on the assay, with biological variability often dominating.
Engineering tolerance checks: under 1% for precision components.
The right threshold is the smallest error that lets you answer your scientific question. If your hypothesis predicts a 10% change, you do not need 1% precision. If you are testing a 0.5% effect, you do.
Frequently Asked Questions
How do you reduce experimental errors?
Reduce experimental errors by combining calibration, repetition, environmental control, and protocol discipline. Calibrate instruments against known references, repeat measurements 10 or more times to shrink random error, control temperature and vibration, and use written procedures to keep operators consistent. Systematic error requires identifying and removing the bias source; random error responds to averaging.
How can you improve the repeatability of an experiment?
Improve repeatability by standardizing every variable you can. Use the same calibrated instruments, same setup geometry, same protocol order, same environmental conditions, and same operator training. Document each step in a written procedure so any researcher can reproduce the exact conditions. Repeat the full experiment from scratch, not just the final reading, to capture true variance.
How do you reduce measurement error in research?
Reduce measurement error in research through a layered approach: calibrate against traceable standards, run blank and control samples to catch bias, repeat measurements to shrink random scatter, control environmental factors like temperature and humidity, train all operators on the same protocol, and report uncertainty with every value. Statistical analysis of repeated trials quantifies remaining error.
Does repeating an experiment reduce random error?
Yes, repeating an experiment reduces random error by a factor of 1 over the square root of n. Four repeats cut the error in half, nine repeats cut it to one-third, and 100 repeats cut it by a factor of 10. Repeating does not reduce systematic error, only random scatter. Independent repetitions are required, not just re-reading the same value.
What is an acceptable experimental error?
Acceptable experimental error depends on the field and the question being asked. Introductory physics labs consider 5 to 10% acceptable, analytical chemistry typically aims for 1 to 3%, and precision engineering often requires under 1%. The threshold should be set by the smallest effect you need to detect, not by what is convenient to achieve.
Final Thoughts on Building Repeatable Experiments
Learning how to make repeatable measurements and reduce experimental error is mostly about habits, not hardware. Calibrate before you measure. Repeat enough times to shrink random scatter. Control the environment. Write down every step. Report your uncertainty honestly.
Our team treats measurement error reduction as an ongoing practice. Every dataset teaches us something new about a bias we missed or a protocol gap. Start with the methods above, apply them consistently, and your experimental results will become something other labs can actually reproduce. That is the foundation of real science.