
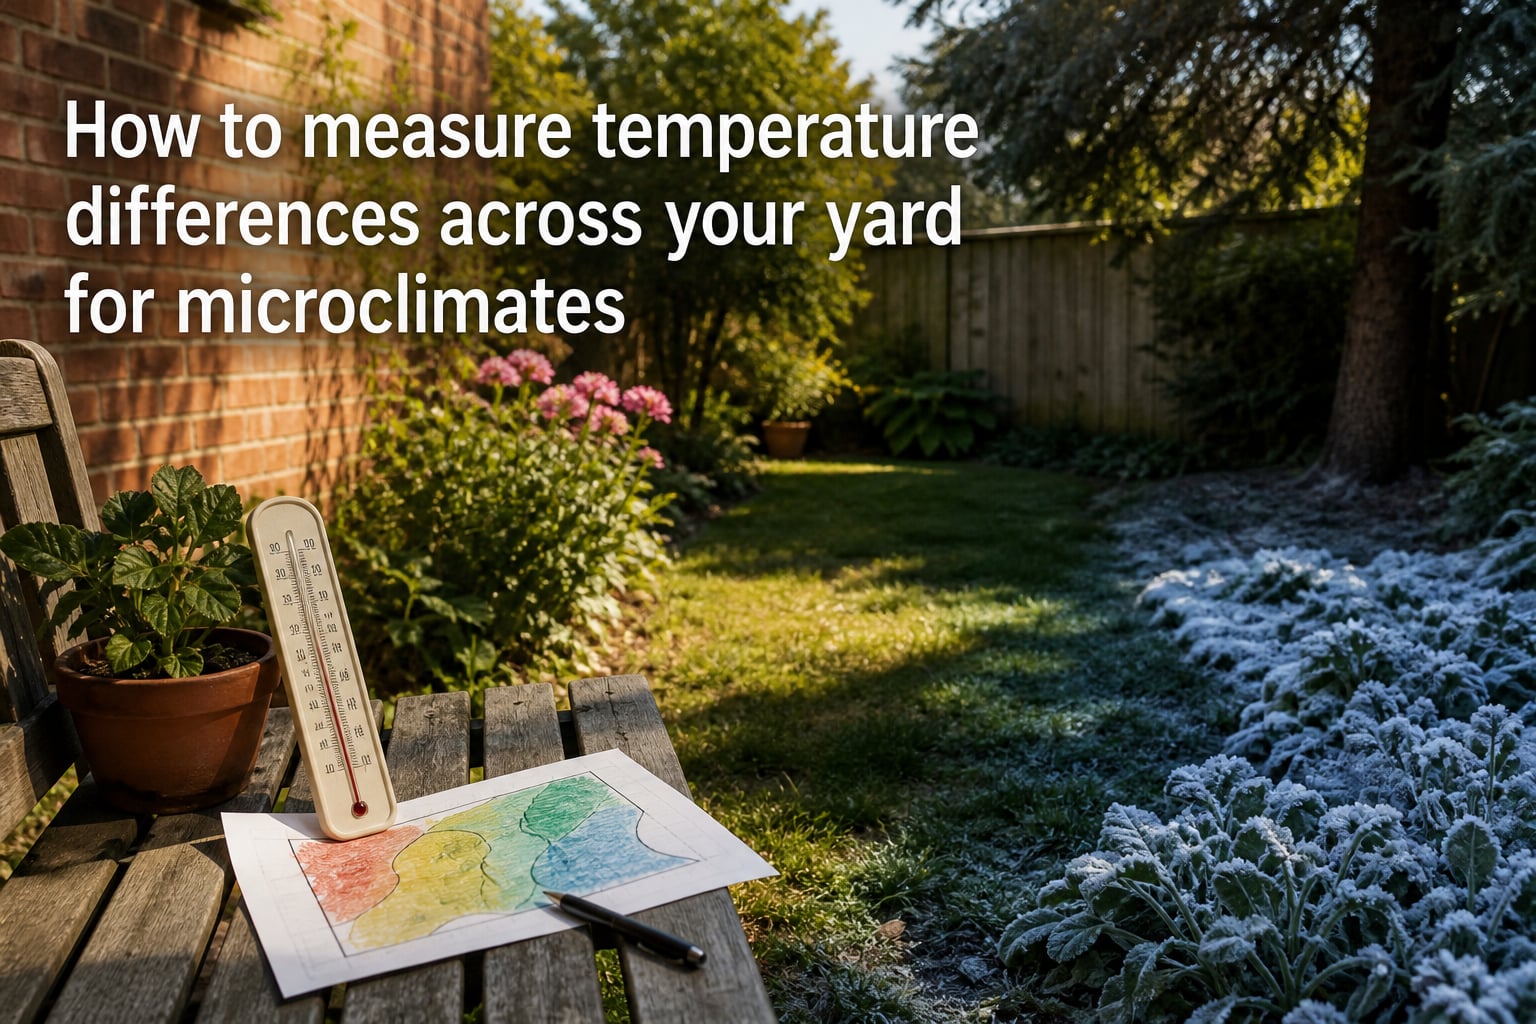
Last spring, my neighbor lost three tomato plants to a late frost while my garden, just 40 feet away, came through unscathed. The difference wasn’t luck. It was microclimate. Once I started learning how to measure temperature differences across my yard, I stopped guessing where to plant and started working with the conditions my soil and air actually offered.
If you have ever wondered why one corner of your yard thaws out a week earlier than another, or why your neighbor’s hydrangeas bloom while yours struggle, the answer is almost always microclimate. This guide walks through exactly how to measure those differences, what to do with the data, and how to turn your yard into a more predictable place to grow.
Table of Contents
What Is a Microclimate and Why It Matters in Your Yard?
A microclimate is a small area where the temperature, humidity, or wind conditions differ from the surrounding region. In a typical suburban yard, you can have several distinct microclimates within a few hundred square feet, each with its own growing conditions.
Microclimates form because of four main factors working together. Sun exposure angle determines how much solar energy a spot receives. Wind patterns move heat and moisture around. Surface materials like concrete, grass, and mulch absorb and release heat at different rates. Elevation and topography shift air temperatures as it pools or drains.
I learned the hard way that guessing about these zones leads to wasted plants. When I finally started measuring, I found a 7 degree Fahrenheit difference between my front and back yard on the same morning. That single number reshaped where I put my herbs, my citrus, and my tomatoes.
Understanding microclimates matters because it lets you match plants to the spots where they will actually thrive, instead of fighting your yard. It also helps you protect tender plants from frost pockets and extend your growing season by a few critical weeks on either end.
Compass Direction Analysis: How Exposure Shapes Temperature
Compass direction is the single biggest driver of microclimate temperature in most yards. The sun tracks across the southern sky in the Northern Hemisphere, so each side of your house receives a different mix of light, wind, and moisture.
Southern exposure gets the most direct sun throughout the day. Walls facing south absorb heat during the day and radiate it back at night, creating the warmest microclimate on most properties. This is where marginally hardy plants have the best chance of surviving winter.
Eastern exposure catches the cool morning sun and is typically less windy. These spots tend to be moister and stay cooler in summer, which suits leafy greens and plants that bolt in afternoon heat.
Western exposure takes the brunt of hot afternoon sun. In summer, walls and soil here can run 10 to 15 degrees hotter than the east side. Wind exposure is often higher on the west side too. This microclimate works for heat-loving plants but stresses cool-season crops.
Northern exposure receives the least direct sun. It stays cooler, holds moisture longer, and is the first place to frost in fall and the last to thaw in spring. Use these spots for plants that prefer shade or for delaying crops that bolt easily.
A quick rule I use: in winter, the warmest side of your house is almost always south or southwest. In summer, the hottest side is west. Measure both to confirm what your specific site is doing.
Tools and Techniques for Measuring Yard Temperature
You do not need expensive gear to get useful data. I started with a $12 min/max thermometer and a notebook, and learned more in one season than I had in a decade of guessing.
For air temperature, a standard min/max thermometer works well. Mount it in a shaded, ventilated spot about 4 to 5 feet above the ground, away from walls and pavement. Direct sunlight on the sensor will give you inflated readings.
For continuous data, a basic data logger or home weather station records temperature every few minutes. These run between $30 and $150 and let you see overnight lows, daytime peaks, and how fast your yard warms after sunrise.
For soil temperature, a soil thermometer with a 6 to 8 inch probe tells you what roots are actually experiencing. Push it in at the same depth you plan to plant and check at the same time of day for comparison.
Infrared thermometers are a nice addition for quick spot checks. They let you compare surface temperatures on different materials, like concrete versus grass versus mulch, without leaving a sensor in place.
Whatever tool you pick, calibration matters. Check your readings against your local weather station or NOAA data once a month. If your thermometer consistently reads 2 degrees high, write that correction in your notebook and apply it.
Step-by-Step Process: How to Measure Temperature Differences Across Your Yard
Here is the exact process I follow each season to build a temperature map of my yard. It takes one weekend to set up and about 10 minutes a day to maintain.
Pick your measurement stations. Choose 4 to 6 spots across your yard. Include at least one in each compass exposure, one in full sun, one in deep shade, and one low spot where cold air might pool.
Mount your thermometers. Place each one 4 to 5 feet off the ground, in a shaded shelter that allows airflow. A white louvered box works perfectly. Avoid direct sun on the sensor.
Record baseline data. For one week, log temperature three times a day: 7 AM, 1 PM, and 9 PM. Note the weather: clear, cloudy, rainy. This shows you the daily swing in each microclimate.
Add a soil thermometer. At each station, take a soil reading at 4 inches deep at the same times. Soil temperature responds more slowly than air, so it tells you about sustained warmth.
Track min and max for two weeks. Reset your min/max thermometers each morning and night. Record the daily high and low for each station. This catches overnight cooling that morning readings miss.
Plot your results. Sketch a simple overhead map of your yard and label each station with its average temperature range. After two weeks, you will see clear hot and cold zones.
Repeat seasonally. Run the same process in spring, summer, fall, and early winter. Microclimates shift as the sun angle changes, so a July reading tells you little about January conditions.
Validate with frost events. After any frost, walk your yard and note exactly where ice formed. These spots are your true frost pockets, and they will recur every year.
Step 8 is the one most guides skip, and it is the most valuable. Real frost tells you more about your yard than any thermometer reading.
Light, Wind, and Surface Materials That Affect Readings
Thermometer readings only tell you part of the story. Three other factors shape how your plants experience temperature: light, wind, and the surface under their roots.
Light patterns change throughout the day. A spot in full sun at 10 AM may be in deep shade by 2 PM as the sun moves behind your house. I spent one Saturday sketching the shadow lines on my yard every hour from 9 AM to 5 PM. That single sheet of paper revealed more about microclimate than any sensor.
Wind exposure strips heat from leaves and soil. A sheltered corner near a fence can be 3 to 5 degrees warmer than an exposed ridge in the same yard. Note where prevailing winds hit your property and where they are blocked. Plants on the leeward side of a windbreak experience a much milder microclimate.
Surface materials have a huge effect on temperature readings. Concrete and asphalt absorb heat all day and release it at night, creating heat islands. Grass and soil cool faster. A thermometer placed 6 inches above concrete at 2 PM can read 8 to 12 degrees higher than the same thermometer over grass.
To get clean data, always measure over the same surface type when comparing stations. If you want to know the air temperature your plants feel, keep your thermometer over grass or soil, not pavement.
Mulch color matters too. Dark mulch absorbs more heat, light mulch reflects it. If you have a hot west-facing bed, switching to light-colored mulch can drop soil temperature by several degrees.
Mapping Your Yard: Creating a Temperature Zone Map
Data without a map is just numbers. Once you have two weeks of readings, turn them into a visual map you can actually use.
Grab a piece of graph paper and sketch your yard to scale. Mark your house, fences, large trees, and any fixed features. Then add your measurement stations with a small circle for each.
Use color or shading to show temperature zones. I use three colors: red for the warmest spots, yellow for average, and blue for the coolest. After a season of data, this map becomes the single most useful planning tool in my garden shed.
Layer in your other observations. Add arrows for wind direction, circles for shade duration, and notes for frost pockets. Suddenly you have a complete microclimate map that captures air, soil, light, and wind in one place.
Apps like Garden Plan Pro or even a simple spreadsheet can help, but a paper map on the wall works just as well. The point is to have a visual reference you can glance at when deciding where to plant something new.
Soil Temperature Considerations for Microclimate Analysis
Air temperature gets most of the attention, but soil temperature is what your plants actually live in. Roots respond to soil temperature, not the air 4 feet above them.
Soil warms and cools slowly because of its thermal mass. A south-facing raised bed with stone walls will hold heat long after the air has cooled at night. A north-facing clay bed stays cold well into spring.
Ground temperature also stabilizes with depth. At about 3 feet down, soil temperature holds nearly constant year-round, often in the 50 to 60 degree range depending on your region. This is why root cellars work and why deep-planted bulbs survive harsh winters.
For practical purposes, focus your soil measurements at planting depth. For most vegetables, that is 4 to 6 inches. Measure at the same time each day, ideally mid-morning, so you can compare stations fairly.
Frost pockets are partly a soil story too. Cold, dense air sinks and pools in low spots, but cold soil compounds the effect. A low corner with heavy clay soil can frost even when nearby sandy beds stay safe.
Using Microclimate Data for Garden Planning
Once you have your map, the fun begins. You can now place plants where they will thrive instead of where they will struggle.
Put your most tender plants in your warmest microclimates. That south-facing wall corner is the spot for figs, citrus, or that marginally hardy rose you have been wanting to try. Save it for plants that actually need the heat.
Use your cool spots to extend your season. A north-facing bed stays cooler in summer, letting you grow lettuce and spinach well past the point where they bolt in hotter spots.
Create shelter where you need it. A simple windbreak of shrubs or a small fence can shift a microclimate several degrees. Planting on the leeward side of a structure gives tender plants a fighting chance.
Adjust your watering to match soil temperature. Cool soils hold moisture longer. Warm, well-drained spots dry out faster and may need deeper, less frequent watering.
Frequently Asked Questions
How do you measure a microclimate?
Measure a microclimate by placing min/max thermometers in shaded, ventilated spots at 4 to 5 feet above the ground across 4 to 6 yard locations. Log temperatures three times a day for two weeks, then plot the data on a yard map to identify hot, cool, and frost-prone zones.
Which side of the house is warmest in winter?
In the Northern Hemisphere, the south or southwest side of a house is warmest in winter because it receives the most direct sun and the wall radiates stored heat back at night. Measure your specific yard to confirm, as trees and structures can shift this pattern.
What is the temperature of the ground about 3 feet deep?
At about 3 feet deep, soil temperature stays nearly constant year-round, typically between 50 and 60 degrees Fahrenheit in most temperate regions. This stability is why root cellars work and why deep-planted bulbs survive harsh winters.
How do you create a warmer microclimate in your yard?
Create a warmer microclimate by planting near a south-facing wall, adding a windbreak on the prevailing wind side, using dark mulch to absorb heat, and covering soil with stone or brick that releases warmth overnight. A simple cold frame can add another 5 to 10 degrees.
Final Thoughts on Tracking Microclimates in 2026
Learning how to measure temperature differences across your yard for microclimates is one of the highest-value projects you can take on as a gardener. A weekend of setup and a few minutes of daily logging will pay off for years.
Pick your stations, set up your thermometers, and start recording. By the time next winter rolls around, you will know exactly where the frost pockets are, where the warm wall hides, and where to plant that citrus you have been dreaming about. Your yard has been telling its story all along. Now you have the tools to listen.