
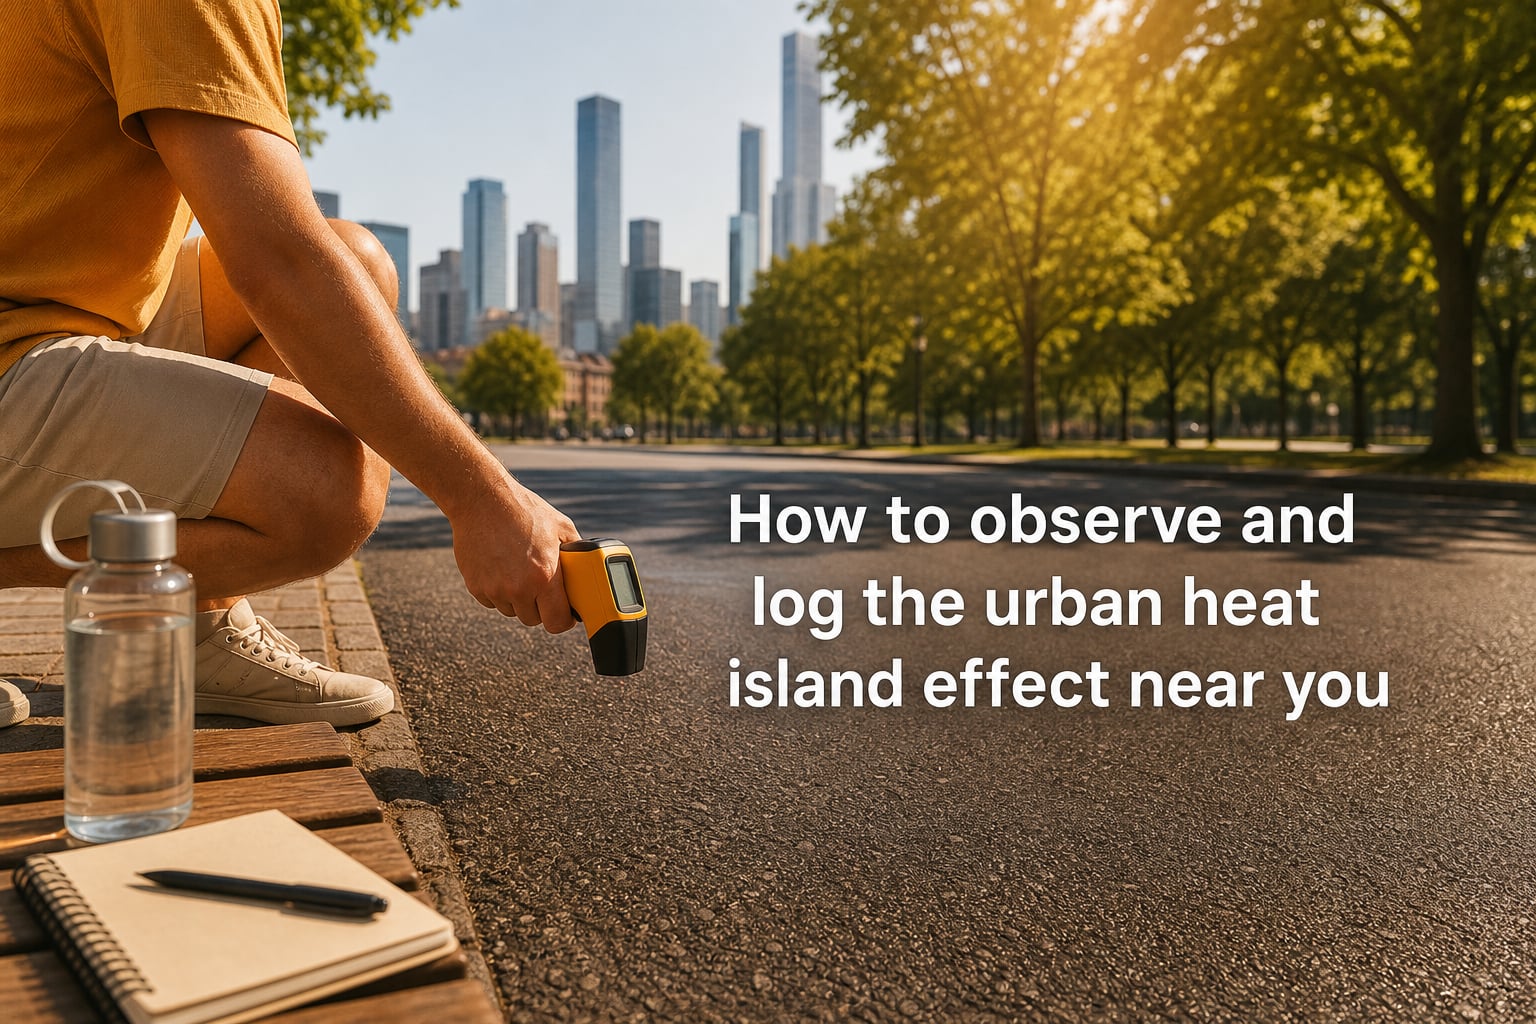
Last July, I watched snow melt three days faster in the parking lot beside my apartment than it did in the park a mile away. That small observation was my first real hook into the urban heat island effect, and it pulled me into a citizen science hobby I have stuck with for two summers running. In this guide, I will walk you through how to observe and log the urban heat island effect near you, using the same methods I picked up from NOAA heat mapping volunteers and university extension programs.
The urban heat island effect is the measurable increase in ambient urban air temperatures resulting primarily from the replacement of vegetation with buildings, roads, and other heat-absorbing infrastructure, causing cities to be warmer than surrounding rural areas. On average, a city center can run 1 to 7 degrees Fahrenheit hotter during the day and 2 to 5 degrees hotter at night than the countryside nearby. Those numbers sound small until you add humidity, stagnant air, and a heat wave on top of them. According to the EPA, urban heat islands already contribute to thousands of premature deaths across the United States each year, and the problem grows worse every time a parking lot replaces a tree canopy.
By the end of this article, you will know how to plan a heat observation walk, what tools to use, how to record data that scientists will actually accept, and where to submit your measurements so they count toward a real heat mapping campaign. You will also know how to stay safe while doing it, because chasing shade temperatures in the middle of August is a special kind of research.
Table of Contents
What Is the Urban Heat Island Effect?
The urban heat island effect is the phenomenon where cities and suburbs hold onto more heat than the rural areas around them. The term comes from the way satellite temperature maps show a warm “island” hovering over a metropolitan area, even when the surrounding countryside is cooler. This temperature gap is most visible at night, when streets and rooftops keep releasing stored solar energy long after the sun has set.
You can think of it as a thermal memory problem. Pavement, brick, and dark roofing absorb sunlight during the day through a property called albedo. Albedo is a measure of how much sunlight a surface reflects versus how much it absorbs. A black asphalt road has a low albedo, meaning it soaks up most of the sun’s energy. A white roof or a sandy patch of ground has a high albedo and reflects that energy back. Once a low-albedo surface absorbs the heat, it stores the energy in its thermal mass, the ability of a material to hold and slowly release heat. Concrete, stone, and asphalt have very high thermal mass, which is why a city sidewalk can still feel warm under your shoes at midnight.
Two other terms matter for understanding this. Evapotranspiration is the process by which plants release water vapor from their leaves, which cools the surrounding air much like sweat cools our skin. When a neighborhood loses trees and grass, evapotranspiration drops, and so does the natural cooling effect. Anthropogenic heat is the heat released by human activity, including air conditioners, cars, factories, and even streetlights. Pumping heat out of a building with an AC unit is like running a refrigerator in a small kitchen. The room gets cooler, but the kitchen gets warmer.
Heat islands form at three scales. A small scale version happens on a single street where a row of buildings blocks the sky and traps longwave radiation. A neighborhood scale version shows up where an entire district lacks tree cover. A regional scale version is the well-known dome of heat that hovers over a major city and can be picked up by weather satellites. Each scale is observable on foot, which is good news for citizen scientists like you and me.
Why Observing and Logging UHI Data Near You Matters?
Official weather stations are often sited at airports or in parks, which can miss the hottest parts of a city entirely. A station at the edge of a downtown might report 92 degrees Fahrenheit while three miles away, in a low-income neighborhood with concrete courtyards and minimal tree canopy, the same time of day could feel like 102 degrees. That gap is exactly the data gap your observations can fill.
Heat mapping campaigns depend on volunteers driving or walking through cities with sensors strapped to their cars or backpacks. The results help researchers identify hot spots that need shade, cooling centers, or tree planting. They also feed into urban planning decisions about where to install green roofs, reflective pavements, and water features. In a 2023 study, Climate Central used this kind of data to show that about 80 percent of the U.S. population lives in cities where the urban heat island effect can worsen heat extremes. None of those numbers would exist without on-the-ground measurements.
There is also an equity reason to log heat data. Studies show that lower-income neighborhoods and communities of color often have less tree canopy and more pavement, which means they bear a disproportionate share of the heat burden. Your observations can help local nonprofits make the case for cooling infrastructure in the places that need it most. One volunteer in a Phoenix community, working with ASU researchers, helped identify a five-degree temperature difference between two adjacent ZIP codes, which later informed a tree planting grant.
What Causes Urban Heat Islands in Cities and Neighborhoods?
Several factors stack on top of each other to create an urban heat island. Understanding them helps you predict where the hot spots will be before you walk out the door.
First, dense construction materials absorb more solar radiation than natural landscapes. Asphalt, concrete, brick, and dark roofing can reach surface temperatures 50 to 80 degrees Fahrenheit hotter than the air around them. I once pointed an infrared thermometer at a black playground on a 90 degree day and saw a reading over 140 degrees Fahrenheit. That is hot enough to burn a child’s hand.
Second, buildings create urban canyons that trap longwave radiation. Tall, narrow streets between high walls of stone or brick block the sky from view, slowing the overnight release of heat. If you have ever noticed how a deep alley stays warm while an open field cools off, you have seen an urban canyon at work.
Third, vegetation is often removed and replaced with impervious surfaces. A parking lot does not transpire water, does not cast shade, and does not reflect much light. The loss of evapotranspiration alone can raise local air temperatures by several degrees. This is why a single mature tree can cool the air beneath it by up to 2 to 4 degrees Fahrenheit.
Fourth, anthropogenic heat from cars, factories, HVAC systems, and lights adds to the load. In some dense Asian megacities, this human-derived heat can shift average temperatures by 1 to 2 degrees Fahrenheit on its own. Even in smaller U.S. cities, the heat from a single large shopping center can be felt across a few blocks.
Finally, air pollution from vehicles and industry often gets caught in the same low-airflow zones that hold heat. Particulate matter not only harms lungs but also affects how much sunlight reaches the ground and how it is absorbed. That is why heat islands and air quality problems often overlap in the same neighborhoods.
How to Observe the Urban Heat Island Effect: Step-by-Step Method
Once you understand the forces at play, observation becomes a matter of routine. Here is the method I follow every July and August, adapted from the protocols used by NOAA-funded heat mapping campaigns. I usually run this loop on three separate days during a summer week, then average the results.
Step 1: Pick your observation week. Aim for a stretch of three to four days with clear skies, light wind, and high temperatures above 85 degrees Fahrenheit. Avoid rainy days, cold fronts, or heat waves, because those extremes will skew your data. Mid-July through mid-August works for most of the U.S. and Europe. For tropical climates, the dry season gives you the cleanest datasets.
Step 2: Choose observation times. The hottest part of the day is usually between 3 and 5 PM, which is when surface temperatures peak. The most diagnostic time for the heat island effect, however, is one to two hours after sunset, when rural areas cool fast but cities keep radiating heat. Plan two observation passes per day, one mid-afternoon and one late evening.
Step 3: Plan your route. Pick a path that crosses multiple land cover types. I like a loop that hits a parking lot, a residential street with mature trees, a park, a downtown sidewalk, and a highway overpass. Mark each waypoint with its GPS coordinates on your phone before you leave home.
Step 4: Calibrate your sensor. Before the route, take a baseline reading in the shade for ten minutes. Write down the temperature. This is your reference point. If your sensor drifts more than 1 degree during the route, you will know to flag those readings.
Step 5: Take measurements at each waypoint. At each stop, log the air temperature in the shade, the air temperature in direct sunlight, and the surface temperature of the dominant ground cover. Hold the infrared thermometer about 12 inches from the surface and aim at the same type of material each time. Take three readings at each spot and average them.
Step 6: Record conditions. Note the time, sky condition (clear, hazy, cloudy), wind estimate using the Beaufort scale, and your location. A simple notebook or a spreadsheet on your phone works fine. I prefer a printed paper log because batteries die in the heat.
Step 7: Do a control point. At the end of the route, return to your starting point and take a final reading. If it has changed more than 2 degrees, mark the session as suspect and repeat it on a later day.
Tools You Need to Measure Urban Temperatures at Home
You do not need a research-grade weather station to contribute useful data. Most of the gear I started with cost less than a hundred dollars total, and some of it was already in my kitchen drawer.
An infrared thermometer is the single most useful tool for measuring surface temperatures. Handheld models from brands like Etekcity or Fluke can be found for $20 to $80 and read temperatures from a distance without touching the surface. Point one at a bench, a wall, or a patch of grass and you will see surface temperature differences instantly. Look for a model with an emissivity setting so you can tune it for asphalt, brick, or foliage.
A digital hygrometer with a remote probe gives you air temperature and humidity at the same time. These small white boxes are sold for indoor greenhouses for about $15 to $30 and work well for outdoor shaded readings. Mount one in a white wooden shelter with ventilation slats and you have a basic weather station.
If you want to go further, a personal weather station like those from AcuRite or Davis Instruments will log air temperature, humidity, pressure, and wind to a memory card. Prices start around $100 and go up to $500 for research-grade units. The Davis Vantage Vue is a popular choice for serious citizen scientists, and the data files it produces are accepted by some NOAA programs.
For surface measurements, a cheap contact probe thermometer with a flat tip reads whatever it touches. A soil thermometer from a garden store works for grass and dirt. For pavement, an infrared thermometer is faster and safer since you do not need to kneel on hot asphalt.
Finally, your smartphone is a data logger and a GPS receiver in one. Apps like phyphox, Weather Underground, or OpenSensorHub let you record sensor data and tag your location. Some citizen science campaigns even provide their own apps that format the data for you, which is what I use on mapping days.
How to Log Urban Heat Island Data Properly
Good data logging is the difference between a fun afternoon and a useful scientific contribution. The format scientists want is simple: a table with one row per measurement and consistent columns for time, location, sensor, conditions, and reading type.
Use a spreadsheet with these columns: date, time (24 hour format), latitude, longitude, waypoint name, air temperature shaded, air temperature in sunlight, surface temperature, surface material, sky condition, wind estimate, and notes. Save the file as CSV, which is the format most databases accept.
Be consistent about timing. Take readings at the same clock minute each pass, or at least within a ten minute window. Heat changes fast, so a measurement at 3:00 PM and another at 5:30 PM at the same spot are not comparable. When logging, always note the exact time of each reading.
Be consistent about sensor placement. Define a height for your air temperature sensor, ideally 4 to 6 feet above ground, and keep it there. The standard for citizen weather stations is about 5 feet, so the heat from the ground does not skew the reading. For surface temperatures, hold the infrared thermometer at the same angle and distance every time.
Add metadata. Each file should include the sensor model, calibration date, observer name, and route description. That way, if a researcher has questions about your data six months later, they can interpret it correctly. I keep a small text file with my sensor specs in the same folder as my CSV.
Finally, back up your data. Cloud storage through Google Drive, Dropbox, or iCloud is free and protects your work. After two summers of observations, I have several thousand rows of data, and I am grateful I uploaded them every week instead of waiting until I lost a notebook.
Where to Submit Your Heat Data: Citizen Science Programs and NOAA Campaigns
Collecting data is rewarding, but the real impact comes when you share it with scientists and city planners. Here are the main programs that welcome volunteer heat observations in 2026.
The NOAA Heat Watch program is the most established citizen science heat mapping effort in the United States. It trains volunteers to collect air temperature and humidity data along driving and biking routes on a single hot day each summer. The data feeds into a national database used by city agencies and researchers. Check the NOAA urban heat island page each spring to see if your city is on the campaign list. If it is, sign up to volunteer, and you will receive training and a calibrated sensor.
The GLOBE Program, run by NASA and NOAA, accepts temperature and land cover data from anywhere in the world. Students and adults can submit observations through an app, and the data is publicly available. GLOBE is especially useful if you want your observations to be part of a long-term dataset that NASA satellites can compare against.
mPING is a citizen science project that crowdsources weather observations, including temperature and precipitation, from volunteers. While mPING focuses on precipitation types, it has expanded to include thunderstorm and heat-related reporting. The app is free and works offline.
Local university extension programs often run smaller heat mapping projects. Search “[your city] heat island citizen science” or contact your state’s climate office. In my area, a regional university partnered with the local Sierra Club chapter to map heat in three neighborhoods last summer, and the volunteers included high school students and retirees.
Finally, municipal open data portals sometimes accept community-submitted observations. Check your city’s data portal for a heat or environment category. Some cities, including Boston and Phoenix, have formal processes for crowdsourced heat data that feed into their resilience plans.
Safety Considerations for Heat Observation
You are deliberately going outside during the hottest part of the day in already hot locations. Take safety seriously, because heat illness can sneak up on you even if you feel fine at the start.
Carry at least one liter of water per hour of observation. Drink before you feel thirsty. Wear a light-colored, loose-fitting hat and apply sunscreen to any exposed skin. Avoid the route in the middle of the day if your area is under a heat advisory, and reschedule for a cooler day if the heat index climbs above 105 degrees Fahrenheit.
Work with a partner whenever possible. Two people can take turns holding sensors, and one can call for help if the other shows signs of heat exhaustion. Symptoms include dizziness, headache, nausea, and clammy skin. If anyone feels off, stop immediately, find shade, and hydrate.
Be careful with your equipment. Infrared thermometers and smartphones can overheat in direct sun and give wrong readings. Keep them in a shaded bag between waypoints, and let them cool before you trust the next measurement. I lost a phone to overheating on a 102 degree day, and I have not made that mistake again.
What to Do With Your UHI Data: Sharing and Advocacy
Once you have a season of clean data, you can use it in ways that go beyond personal curiosity. A short summary report with a few maps and a paragraph of context is enough to share with a neighborhood association, a school board, or a city council member. Many local governments are actively looking for resident input on climate resilience plans, and a clear block-by-block heat map is more persuasive than a generic complaint about summer heat.
You can also partner with local nonprofits focused on tree planting, green roofs, or shade equity. Groups like TreePeople, Heat Justice, or local land trusts often have the funding and permissions to act on neighborhood-scale heat data. Volunteer your time and your measurements to help them prioritize sites. In my own neighborhood, a coalition used a season of citizen data to win a grant for 200 new street trees.
If you are a teacher or a parent, this project scales beautifully for classrooms. Students can do the same routes during a school week and present their findings. Several NOAA-published curricula are available for grade levels from middle school through college, and the data your students collect can be uploaded to GLOBE for credit.
Frequently Asked Questions About Observing Urban Heat Islands
What is the urban heat island effect in simple terms?
The urban heat island effect is when cities become noticeably warmer than the surrounding countryside. Buildings, roads, and rooftops absorb sunlight during the day and release it slowly at night, while fewer trees means less natural cooling. The result is a pocket of warm air that hovers over a city, especially after sunset.
What causes urban heat islands to form?
Urban heat islands form because dense construction materials like asphalt and concrete absorb and store solar energy, while vegetation that would normally cool the air through shade and evapotranspiration is reduced. Additional heat from cars, air conditioners, and industry adds to the load, and narrow street canyons trap the warm air.
How do scientists measure the urban heat island effect?
Scientists measure it using air temperature sensors, infrared thermometers for surface temperatures, satellite thermal imaging, and mobile transects with calibrated sensors mounted on vehicles. Ground-based measurements from weather stations and citizen science campaigns fill in the details that satellites miss, especially at the neighborhood level.
How can I help measure urban heat in my city?
You can help by joining a NOAA Heat Watch campaign, contributing to the NASA GLOBE Program, or running your own neighborhood transects with an infrared thermometer and a digital hygrometer. Submit your data to a citizen science database, share it with your local government, and partner with schools or nonprofits working on heat equity.
What tools do I need to observe urban heat at home?
At minimum, you need an infrared thermometer for surface temperatures and a digital hygrometer for shaded air temperature. A smartphone with GPS and a notes app is enough for logging. For more rigor, add a personal weather station with a data logger. Total cost for a basic kit can be under $50.
What time of day is best for observing heat islands?
The best time is one to two hours after sunset, when rural areas cool quickly but cities keep releasing stored heat. A secondary observation window is mid-afternoon, between 3 and 5 PM, when surface temperatures peak. Taking measurements at both times gives you a fuller picture of the urban heat island.
How does urban heat affect my neighborhood?
Urban heat raises the risk of heat-related illness, increases air conditioning costs, and worsens air quality. Neighborhoods with less tree cover and more pavement experience the worst effects, and those neighborhoods are often lower income. Logging local temperatures helps identify where cooling resources are needed most.
Start Logging Your Local Urban Heat Island Today
You do not need a degree in climatology to observe and log the urban heat island effect near you. A $20 infrared thermometer, a $15 hygrometer, a notebook, and a few hours of summer afternoon are enough to start. Pick a route, take readings at consistent times, log your conditions, and submit your data to a citizen science program in 2026.
The point of this work is not just to satisfy curiosity. It is to fill the data gaps that satellites and airport weather stations miss, especially in lower-income neighborhoods that already bear the worst heat. Every measurement you take contributes to a clearer picture of how our cities are heating up, and that picture is what city planners, nonprofits, and elected officials use to decide where to plant trees, install cool roofs, and add shade in 2026 and beyond.
Pick a hot, clear day in the next two weeks. Walk your planned route with a thermometer and a notebook. Email your results to a local university or post them on a community map. You will end up with a small dataset, a sunburn if you forgot sunscreen, and a much sharper sense of how your neighborhood is shaped by heat. That is how to observe and log the urban heat island effect near you, and that is how citizen science moves from a hobby into a public good.