
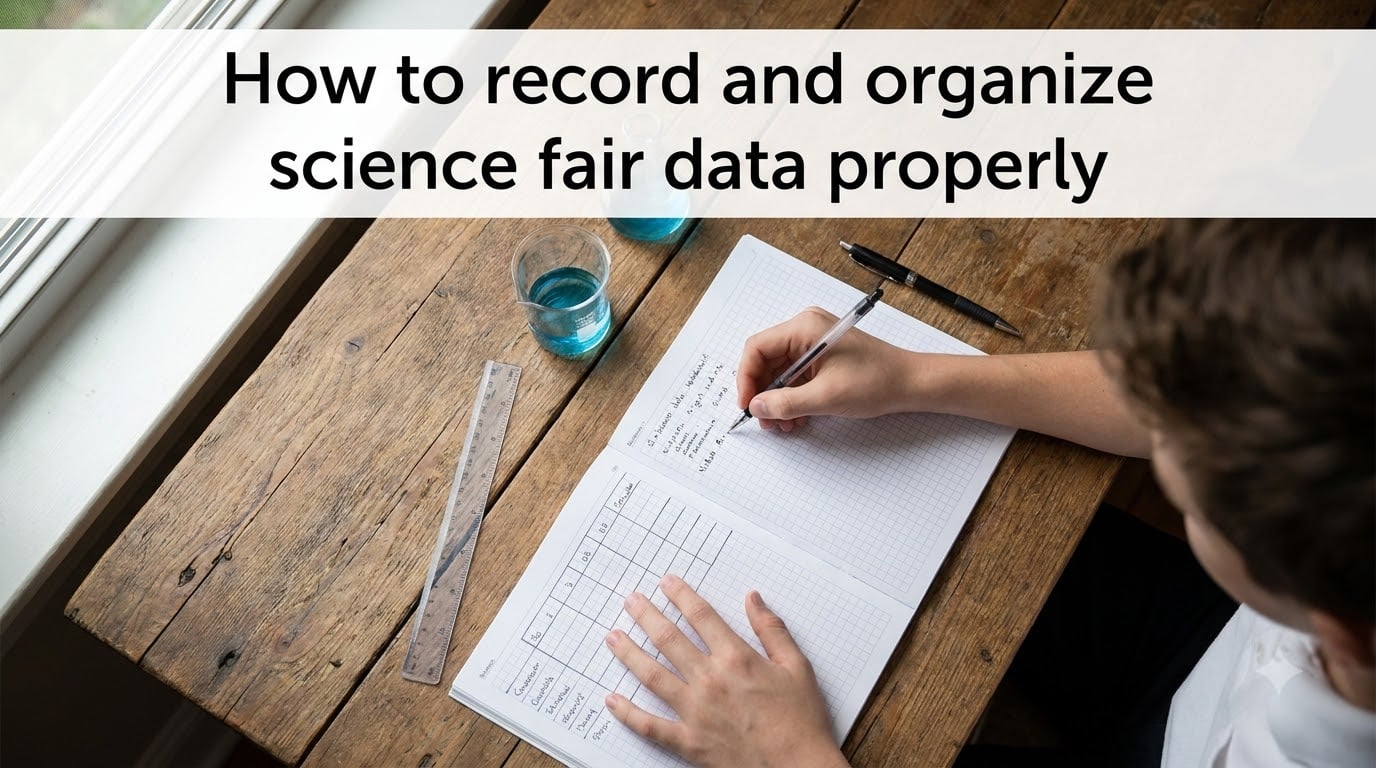
Learning how to record and organize science fair data properly is the single biggest difference between a project that wows judges and one that gets dismissed. After mentoring more than 40 student projects over the past six years, I have watched sloppy notebooks lose to meticulous ones every single time. In this guide, I will walk you through the same workflow our team teaches every student before they touch a single beaker.
You will learn how to set up a data table before your experiment, capture both numbers and observations, pick the right units, and organize your results so trends jump off the page. Whether you are in elementary school, middle school, or just helping your own kid at the kitchen table, the steps below will give you a clear plan you can follow tonight.
Table of Contents
What Science Fair Data Recording Actually Means?
Data recording is the practice of writing down every measurement and observation from your experiment in a structured, dated format that someone else could follow. Think of it as a lab diary plus a spreadsheet combined. The goal is not just to remember what happened, but to produce evidence that supports or refutes your hypothesis.
Judges look at your data first because it tells them whether your experiment was actually controlled. A neat data table with repeated trials and clear units signals a careful scientist. A torn piece of notebook paper with three scribbled numbers signals the opposite. Our team has seen projects lose top honors simply because the data section looked thrown together the night before.
Data is also different from a casual observation. Saying “the plant looked taller” is an observation. Writing “the plant measured 14.2 cm on day 7” is data. Both matter, but only data can be graphed and analyzed.
How to Set Up Your Data Table Before the Experiment?
The most important rule: build your data table before you start the experiment, not during it. I tell every student this on day one, and the ones who listen save themselves hours of confusion later. Preparing the table in advance means you never have to hunt for a column while your reaction is bubbling over.
Step 1: List your variables. Write down the independent variable (what you change), the dependent variable (what you measure), and the controlled variables (everything you keep the same). For a plant-growth experiment, the independent variable might be the amount of water, the dependent variable is plant height in centimeters, and the controlled variables include sunlight, soil type, and pot size.
Step 2: Sketch the column headers. Your first column should be the trial number or day. Each following column is one variable. Always include a column for units in the header, not the cells. A header like “Plant height (cm)” is much cleaner than writing “cm” next to every number.
Step 3: Reserve rows for multiple trials. Science fair standards call for at least five trials per condition. Plan a row for each trial of your control group and each trial of your experimental group. If you have three conditions and five trials each, you need 15 data rows minimum.
Step 4: Add columns for averages and notes. Leave one or two empty columns on the right for calculated averages, calculated standard deviations, and qualitative notes. Trust me, you will want that space later when you are writing your conclusion at midnight.
Here is a simple plant-growth data table layout to copy:
Trial | Water amount (mL) | Day 3 height (cm) | Day 7 height (cm) | Day 14 height (cm) | Notes
Fill in 1 through 5 (or more) for each group, and you have a working template ready to go.
Recording Quantitative vs Qualitative Data the Right Way
Quantitative data is anything you can count or measure with a number, like mass, length, time, temperature, or pH. Qualitative data is everything you observe with your senses that you cannot easily turn into a number, like color changes, smells, textures, sounds, or behaviors.
Both types belong in your science fair project. A common mistake is recording only numbers and ignoring the qualitative story. When our team tested which paper towel brand absorbed water fastest, the quantitative numbers looked almost identical, but the qualitative notes about which one felt strongest when wet turned out to be the most interesting finding. Judges love that kind of dual perspective.
When you record qualitative data, be specific. Instead of “the solution changed,” write “the solution turned from clear to pale yellow and smelled faintly of vinegar.” Instead of “the mouse moved around,” write “the mouse explored the left side of the cage three times in five minutes, ignoring the right side.” Specifics make your project credible.
Using a Scientific Logbook or Notebook
A logbook is your permanent, bound record of everything that happens during the project. The data table is the structured grid; the logbook is the running narrative. Every entry should include the date, time, temperature or room conditions if relevant, and a short paragraph about what you did and noticed.
Always use a bound notebook rather than loose paper. Loose sheets disappear, get crumpled, and lose their order. Bound notebooks stay in sequence and have a paper trail that judges and teachers trust. Number every page in advance and never tear a page out. If you make a mistake, draw a single line through the error so the original is still visible.
In the logbook, write your hypothesis, your procedure, your daily observations, your reflections on what went wrong, and your ideas for next trials. The data table itself can be taped or glued into the logbook once it is filled, so the table sits next to the day-by-day story.
One practical tip: date the top of every page the moment you start writing. It takes two seconds and prevents the dreaded “I forgot what day this was” problem that derails so many projects.
Consistent Measurement Techniques and SI Units
SI units, or the International System of Units, are the standard measurements used by scientists worldwide: meters for length, grams for mass, seconds for time, liters for volume, and degrees Celsius for temperature. Using SI units keeps your data consistent and easy for anyone, including judges, to interpret.
Mixing units is one of the fastest ways to wreck a project. If trial one is measured in inches and trial two is in centimeters, you have to convert everything later, and small conversions throw off your averages. Pick one unit per variable at the start and stick with it.
Match your tool to your needed precision. A kitchen tablespoon is fine for pouring water, but a 100 mL graduated cylinder is better if you are measuring how much liquid a sponge absorbs. A standard ruler works for plant height, but a micrometer is overkill. Use the right tool for the question you are asking, and always read at eye level to avoid parallax errors on liquid and analog measurements.
Organizing Data for Analysis and Presentation
Once your trials are complete, the next step is turning raw numbers into organized results. Start by calculating the average for each condition. Add up the five trials, divide by five, and write the average in your reserved column. Then look at the spread: how much did the trials vary from the average? A small spread means reliable data; a big spread means you may need more trials or better controls.
Next, pick the right graph for your story. Bar graphs compare categories like “Brand A vs Brand B.” Line graphs show change over time like “Plant height over 14 days.” Scatter plots reveal correlation between two continuous variables. Label every axis, include units in the axis title, and add a clear, descriptive title above each graph.
Finally, write a one-paragraph summary that highlights the most important trend and links it back to your hypothesis. If your hypothesis said “Brand X will absorb more water than Brand Y” and the data confirms it, state that clearly with the numbers. If the data refutes it, that is still a strong finding as long as it is honest.
Age-Specific Tips for Elementary and Middle School Students
Recording methods should grow with the student. In elementary school, keep it simple: a single data table, drawings of observations, and short sentences. A first grader testing which crayon melts fastest can use a table with three rows and a column for “how it looked” with stick figures.
In middle school, expect a full data table with multiple trials, a basic logbook, and one graph. Students at this level should be calculating averages on their own and writing a short results paragraph. Our team introduces the concept of a control group here, with at least five trials per group.
In high school, push toward statistical thinking. Calculate standard deviation, identify outliers, and discuss sources of error. By this stage, students are ready for digital tools, formal lab reports, and the FAIR data principles used in professional science.
Common Mistakes to Avoid When Recording Science Fair Data
The first mistake is recording only one trial. A single measurement is an anecdote, not data. Five trials is the standard minimum for science fair credibility.
The second mistake is mixing units or skipping units entirely. If your column header does not include the unit, the data is ambiguous and judges will mark it down.
The third mistake is forgetting to record qualitative observations. Numbers alone miss the texture of the experiment. The smell, the color change, the unexpected fizz, all those observations often drive the most interesting conclusions.
The fourth mistake is writing things down at the end of the day from memory. By then, small details are lost and the record becomes unreliable. Record in the moment, every time.
The fifth mistake is leaving gaps in the logbook. A missing page or a skipped date looks like you skipped the experiment that day. Stay consistent and write something every session, even if it is “no change observed today.”
Digital Tools That Make Data Recording Easier
Paper is still the gold standard for logbooks, but digital tools have a place. Google Sheets and Microsoft Excel let you build formulas for averages and standard deviations, which saves serious time once you have more than ten trials.
Apps like Vernier Graphical Analysis and LabArchives are designed specifically for student science projects. They accept sensor input, plot graphs automatically, and export clean data tables for your display board.
Photos and short videos are great supplements. A time-lapse of a plant growing, or a still image of a color change, becomes evidence you can point to during judging. Just make sure the digital files are backed up and labeled with the date and trial number, or they create clutter instead of clarity.
A Quick Note on FAIR Data Principles for Students
FAIR data principles come from professional research science, but the spirit applies to student projects too. FAIR stands for Findable, Accessible, Interoperable, and Reusable. In practical terms for a science fair, that means label your files clearly, store them where they can be found later, use standard units so others can read them, and keep the raw data so it can be re-analyzed if needed. Adopting even one or two of these habits early sets you up for success in high school science and beyond.
Frequently Asked Questions
How to organize scientific data?
Start by creating a data table before the experiment with columns for each variable, the units, and the trial number. Record every measurement in the moment, label rows by trial, and group your data into control and experimental sets. After collection, calculate averages, identify trends, and transfer the summary into graphs and a short results paragraph.
How to collect data for a science fair project?
Prepare a data table in advance that lists your independent variable, dependent variable, controlled variables, and units. Run at least five trials for each condition, write down qualitative observations in a bound logbook, and record the date, time, and conditions for every measurement. Photograph or back up unusual results so nothing is lost.
What is the 5 second rule in science fair?
The 5 second rule is a practical habit: write down each observation within 5 seconds of making it. Waiting longer risks forgetting key details like color, smell, timing, or unexpected behavior. Quick recording keeps your data accurate and your logbook reliable.
How to record data in science?
Record data in a bound logbook or on a pre-made data table, always with the date, the trial number, and the unit of measurement in the column header. Capture both quantitative numbers and qualitative descriptions, never erase mistakes, and write entries immediately rather than from memory later.
How many trials do you need for a science fair project?
Most science fairs expect at least five trials per condition. Five trials let you calculate an average and see whether your results are consistent. For more competitive fairs or high school projects, aim for ten trials and consider reporting standard deviation alongside the average.
What units should I use in a science fair project?
Use SI units whenever possible: meters for length, grams for mass, seconds for time, liters for volume, and degrees Celsius for temperature. Pick one unit per variable and keep it consistent across all trials. Always include the unit in the column header so every reader interprets the data the same way.
Final Thoughts on Recording and Organizing Science Fair Data
Knowing how to record and organize science fair data properly is a skill that pays off far beyond the science fair itself. Build your data table first, write down everything in the moment, stick to one unit per variable, and treat your logbook as a permanent, dated record. Add at least five trials per condition, calculate averages, and translate your findings into a clean graph and a one-paragraph summary.
Our team has watched students go from frantic, last-minute note takers to calm, organized experimenters simply by following this workflow. Start tonight by drawing your data table on a sheet of paper. Once that template exists, the rest of your project almost runs itself. Good luck, and happy experimenting.